Prototype county-level Gross Domestic Product (GDP) data published by the Bureau of Economic Analysis shows deep pockets of concern for the Kansas economy. The data covers the years 2012 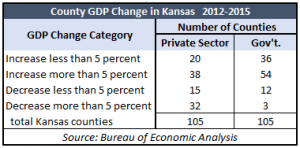 through 2015, showing only 58 of the state’s 105 counties had GDP gains for the private sector, compared to 90 counties showing gains for government GDP. Thirty-two counties had private sector GDP losses or more than 5 percent, while only 3 counties experienced government GDP decline of that magnitude. There are solutions to change the trajectory, of course, but they require a departure from the subsidize-and-spend-more philosophy of many people in government and economic development.
The downloadable listing at the end of this article shows government grew faster than the private sector in 62 counties, and 41 counties had positive GDP government growth but private sector losses. Having government grow faster than the private sector is always bad for the Kansas economy. Using statewide BEA data, government GDP grew faster than the private sector in Kansas in 10 of the 14 years from 1997 through 2010, but restraints on the growth of state spending during the Brownback years kept the private sector growing faster from 2011 through 2017 (final state data hasn’t been published for 2018 at this writing).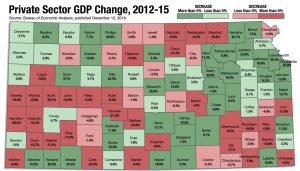
Declining oil and farm commodity prices likely account for some degree of the private sector decline in some counties but not all, as there are multiple instances of growth sprinkled throughout the southern parts of the state.
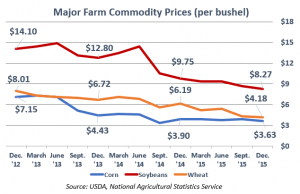 Corn, soybean and wheat prices fell somewhat gradually each year. The three-commodity average dropped from $9.75 per-bushel at the end of 2012 to $7.98 a year later; the 2014 year-end price declined again to $6.61 and fell to $5.36 by the end of 2015.
Cushing Oklahoma crude future prices rose from $88 per barrel at the end of 2012 to $98 at the end of 2013 but dropped to $59 by the end of 2014, and further declined to $37 by the end of 2015.
The Cushing open market prices are a little higher than actual prices for Kansas oil, by the way. Kansas Independent Oil & Gas Association president Ed Cross says, “Kansas common crude is a little lesser quality oil and produces less products per barrel, and as a result, is priced about $10-$11 per barrel less.
Long-term job declines in most counties
The number of people working in Kansas increased by 7.7 percent since 1997 but the state totals mask what’s happening in most counties. The ten largest counties by population experienced a collective 15.3 percent employment gain, while the other 95 counties saw employment decline by 4.1 percent. Those 95 counties had small gains through 2008 but they lost jobs every year since except for a tiny increase in 2014.
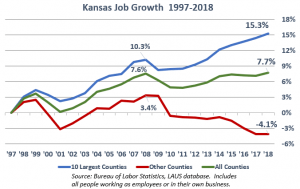 Only 23 Kansas counties have employment gains over the last ten years; four are among the ten largest counties (Douglas, Johnson, Leavenworth and Wyandotte). Of the 82 counties that lost employment over the last ten years, 42 of them had declines worse that 10 percent.
Long term population declines in most counties
The long-term trends on population decline resemble the employment trends; the ten largest counties have fairly steady growth and mask a slow decline in the rest of the state, with the state total averaging about a half percentage point gain since 1997. One notable difference is that the 95 ‘other’ counties lost population through 2008, had a small bump in 2010 but steadily declined thereafter.
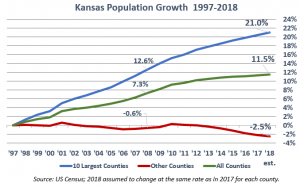
The US Census hasn’t published county population estimates at this writing, so the 2018 estimate assumes each county’s population will change at the same rate as in 2017.
Property taxes rise steadily
While employment and population have seen steady declines in most counties, property tax for local government was growing much faster than inflation and population combined, creating another drag on the Kansas economy.
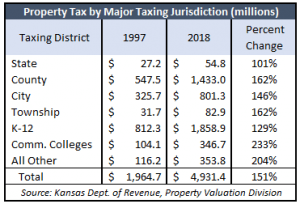 Property tax charged by counties and townships both increased by 162 percent since 1997, and city property taxes increased by 146 percent. Most of the property tax charged by entities listed as ‘All Other’ in the adjacent table are also for local government operations, such as fire districts, libraries, parks and recreation, and tax increment districts; collectively, they increased 204 percent. Inflation meanwhile was just 49.5 percent (CPI for Midwest Cities).
The degree to which excessive property tax hikes are responsible for job and population loss is difficult to ascertain, but anecdotal evidence indicates it is a significant factor.
Kansas has 76 counties that lost population since 1997. Collectively those counties have a 9.9 percent population loss and a 10.4 percent loss in employment, yet county government chose to increase property tax by 152 percent.
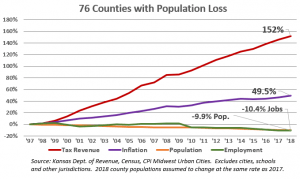
Employment and population loss across the 76 counties track very closely but 15 counties gained employment even though they lost population. The population loss in those counties might be skewed toward retired people, who could be looking for a warmer climate and/or less onerous property taxes, reflective of complaints of being taxed out of their homes.
Conclusion
The economic data is grim for much of the Kansas economy but also instructive: the typical approaches of government subsidies and spending programs simply aren’t working, and the downward spiral across much of Kansas will likely continue unless a different approach is taken.
Fortunately, there are solutions. KPI’s Center for Entrepreneurial Government helps citizens and elected officials explore possible solutions to the many economic challenges facing Kansas. It identifies barriers to success, provides case studies of successful efforts to reduce costs, and offers original research and assistance to state and local elected officials.
County GDP, Jobs, Pop, Prop Tax3Note: the original PDF listing has been revised as of March 26, 2019 to correct the government GDP change for Wyandotte County (down 0.4 percent instead of flat). Property tax change rankings for counties ranked below #57 were revised but the order remains the same.