If you read enough Kansas Association of School Boards (KASB) school funding reports, you’d think education funding in Kansas didn’t exist prior to 2008. That always seems to be the start date whenever KASB writes about how much they think Kansas education is underfunded. The most recent Tallman Education Report is no exception. It’s another example of surgically selecting certain financial data while ignoring other pertinent information. This time the data manipulation is to show that Kansas has trailed the rest of the nation, and in particular the other Plains states in per-pupil funding since – you guessed it – the Great Recession.
Why does Tallman continue to pick 2008? What’s wrong with 2005 when court-ordered money pursuant to the Montoy case started to kick in? Or how about 1992 when the transformative school finance formula, School District Finance and Quality Performance Act (SDFQPA), was adopted? Not only is the starting date curious, but the ending year of 2016 (the latest year of available comparative U.S. Census data) is quite convenient. It fails to include the funding increase approved by the Legislature in 2017.

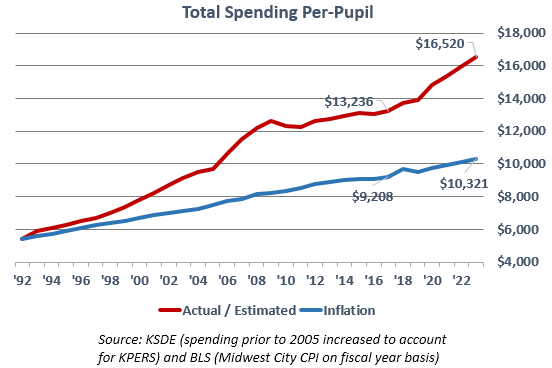
The graph reveals the real school funding picture since the passing of SDFQPA. The separation of the two lines shows just how much spending has outpaced inflation from 1992 to the estimates through 2023. With the addition of over $500 million to K-12 education by the Legislature in the 2018 session, by 2023 per-pupil spending will increase to more than $6,000 above inflation. Of particular note is the funding spike that started in 2005 – one that was ordered by the Supreme Court based on an extremely flawed education cost study – and continued until, coincidentally, the recession impacted state revenues a few years later.
What’s left is a narrow time window that fits KASB’s narrative that education needs more funding. The article even includes a 50-state ranking of adjusted school funding change over that narrow time frame. Kansas ranks 40th.
This report is simply another version of KASB’s inputs-based approach to education. Once again there is not a single mention of student outcomes or achievement, just a bunch of data-jibberish presented to make the reader believe quality education is all about money. If that were true, how do they explain that Florida – the state that ranks dead last on KASB’s revenue ranking – has better performance than Kansas?
Regardless of the facts Tallman chose to use, there are two truths conspicuously missing.
1.Education spending in Kansas has consistently outpaced inflation over the last quarter century. Actual spending for 2017 was about $4,000 per-pupil above inflation and it could be $6,500 per-pupil above inflation by 2023. KSDE estimates that funding already approved plus the cost of meeting the court’s latest demand will push funding to $16,520 per-pupil – and that’s without any increase in federal aid and not much change in local aid.
2.There is no correlation, let alone a causal relationship, between spending and student outcomes. Example after example verifies that, but in this case Tallman’s own data supports that truth. He reports that New York was fourth in spending change with an increase of 18.3%. Kansas dropped 4.9% and Florida dropped a whopping 20.3%. Despite those spending changes, KPI showed in this analysis that Florida outperforms both Kansas and New York in NAEP scores for low income students. That also holds true overall for all students.


