KPI has created a state public education employment metrics report for FY 2014 and the file can be accessed here. The file contains employment totals and also five categories of pupil-per-employee ratios. Here are some highlights and analysis.
Pupils per classroom teacher
The employment metrics file shows considerable variation among the districts when it comes to the number of pupils per classroom teacher. Weskan, with an enrollment of just 92 students has a ratio of 6.2 pupils for every classroom teacher, while Spring Hill with 2,850 students has 20.5 students for every classroom teacher. Among the state’s largest districts, Shawnee Mission has the highest ratio at 17.9 and Salina is the lowest at 14.6. The state median is 13, while the mean is 15.4 pupils per classroom teacher. (KSDE excludes special education and reading specialists from their definition of classroom teaches.).
These ratios are considerably smaller than what is typically reported as classroom size. It is impossible to make an exact comparison because KSDE does not keep data on classroom size.
Administrative manager employment
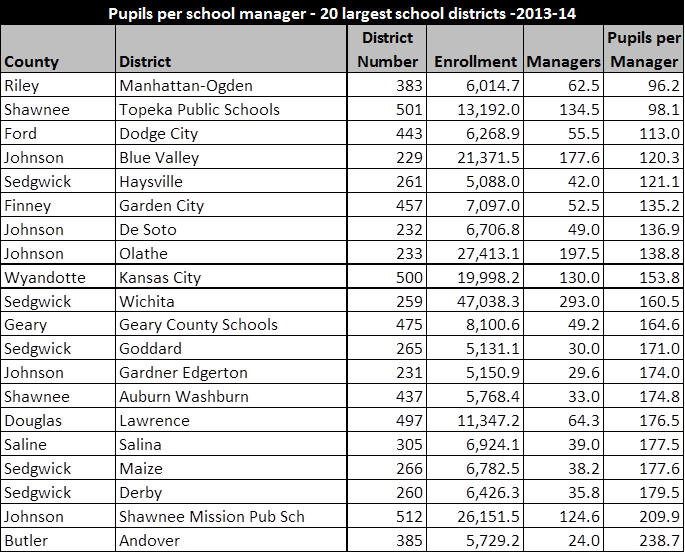
As the table below shows, there is a wide range of pupils per manager* across the state. Manhattan-Ogden (USD 383) carries the distinction of having the most top-heavy administration among the state’s 20 largest districts with a ratio of 96.2 pupils per manager. Contrast that with Andover (USD 385), which has 238.7 pupils-per-manager. Put another way, USD 383 has 5% more students, but 160% more administrators than USD 385.
Among the biggest districts, Shawnee Mission is the most efficient with nearly twice as many pupils per manager than fellow Johnson County district Blue Valley and more than twice as many pupils per manager than Topeka. Shawnee Mission claims an even smaller administrative footprint in FY 2015 in favor of more money going toward instruction.
The following table summarizes the ranges among all districts on a per-pupil basis through the low, high, and median values for each metric.
Special Education Cooperatives and Interlocals Make Comparisons Difficult
Most school districts in Kansas enter into inter-district agreements to provide special education services in an effort to provide those services in a more cost-effective manner. According to the KSDE directory, 252 of the 286 schools districts in the state are part of what is called either a cooperative or an interlocal. Essentially, it means two or more school districts in an area pool their teaching resources to serve special education kids. This distorts the employment reporting for these two reasons:
About half the districts are in cooperatives that list all the employees of the cooperative in only the “home” district of that cooperative. Example: the East Central Kansas Special Education Cooperative consists of 8 districts. The home district, Paola USD 368, reports 60 special education teachers and 253 special education paraprofessionals. The other 7 districts report zero special education teachers and zero special education paraprofessionals.
The remaining cooperatives have been given a school district number (all in the 600s), but the number of special education teachers, paraprofessionals and other employees go unreported. According to the KSDE directory of schools there are 19 such “districts” that include 143 unified school districts. And, according to KSDE, these cooperatives have 5,284 employees, none of whom are included in state employment totals because KSDE only reports employment for unified school districts.
*”Manager” is a KPI defined category that combines the 17 KSDE administrative categories reported by all school districts (superintendents, asst. superintendents, principals, asst. principals, business managers, and directors of all other functions).


