Editor’s Note : The original version of this post was based on published Census data. KPI subsequently discovered that Census inadvertently excluded USD 512 Shawnee Mission data from their reported totals for 2014; KSDE and Census officials confirmed our finding. Census will not republish correct data until 2015 data is released but did provide us with revised Kansas data for Tables 1, 8 and 19 of their report; this post now reflects that updated information.
The U.S. Census Bureau recently released the 2014 education revenue and spending data for the fifty states and District of Columbia. The Census Bureau reports spending per-pupil using what they call “current spending,”* which allows state-to-state comparisons. Having such data enables an updated look at spending levels and student achievement.
Education Week publishes the annual Quality Counts report, which is a report card on the state of education for all 50 states and District of Columbia. The current, 20th annual edition, released earlier this year, relies heavily on the 2015 National Assssment of Educational Progress (NAEP) results to calculate an achievement index for all 51 jurisdictions. Using 12 NAEP indicators (including how well low-income students performed), Quality Counts gives each state a score on a scale of 1 to 100.
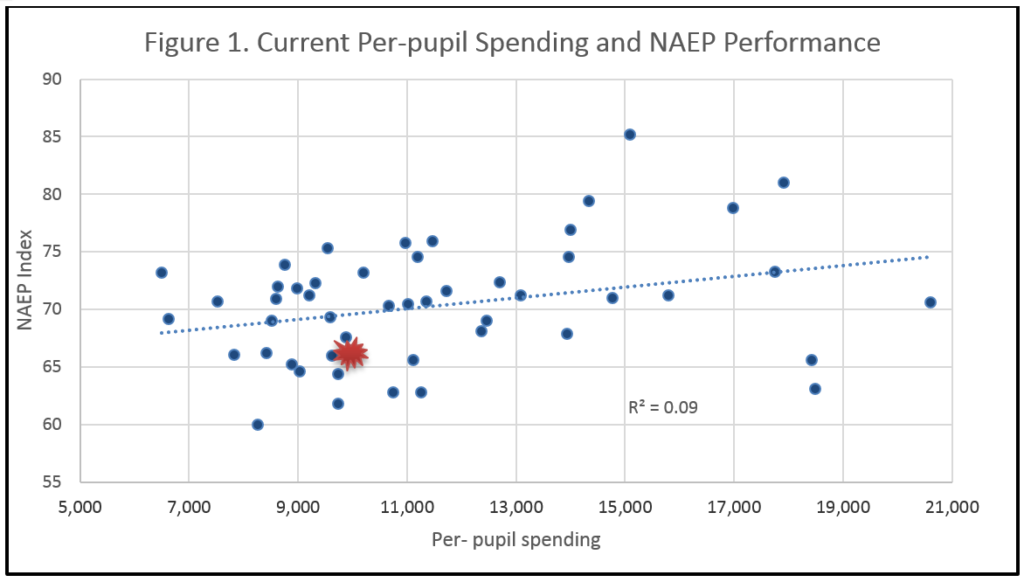
Figure 1 is a scatterplot of the 50 states and D.C. for per-pupil spending (per the new census data) and 2015 NAEP index. It is yet another example of the absence of correlation between per-pupil spending and achievement. The trend line has virtually no slant, and the R2 value, a numeric representation of how close each plotted point is to the trend line, of 0.09 is lower than what is considered even a “weak” correlation. Evidence of a strong correlation would have a scatterplot with a much steeper trend line and a significantly higher R2 value. Here’s the best example of the disconnect between spending and achievement: New York, the state with the highest per-pupil spending, had a lower NAEP index than the state with the lowest per-pupil spending, Utah. Utah’s per-pupil spending is less than one-third of New York’s. The District of Columbia, which had the second highest spending, had the fifth lowest achievement. The Kansas data point is the red starburst.

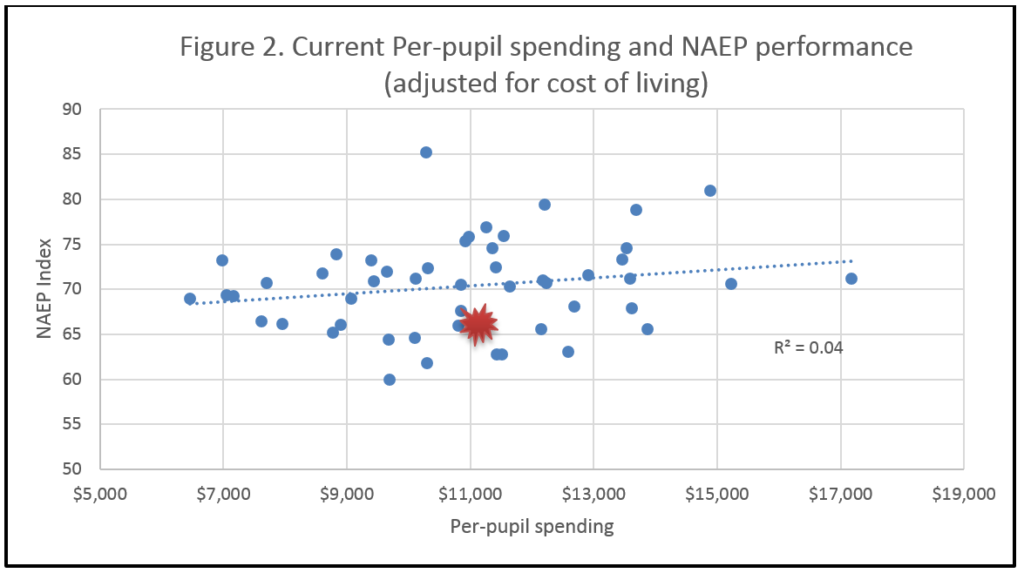
An argument could be made that certainly states like New York, Alaska and Hawaii would spend much more per-pupil due to a higher cost of living in those states. The Missouri Economic Research and Information Center (MERIC), a division of the Missouri Department of Economic Development publishes a cost of living index for every state and D.C. When applying the most recent index (first quarter of 2016) to per-pupil spending the relationship between education spending and achievement is actually weaker. When making the cost of living adjustment Wyoming becomes the highest spending state and Hawaii is the lowest. Despite spending an adjusted amount nearly three times as much, Wyoming students barely exceed the performance of those in Hawaii. Conversely, Massachusetts, the highest performing state has an adjusted per-pupil spending only slightly higher than Mississippi, the lowest performing state. (Again, Kansas is the red starburst.)
 This lack of correlation between spending and achievement is a virtual mirror image of the one reported in this blog, a response to the Quality Counts report, in which NAEP scores were paired with state education spending as a percentage of total taxable resources.
For those in the education community who continue to bang the drum for money, what’s the justification when it is clear that more money doesn’t lead to higher ending and outcomes, let alone a causal relationship?
*“Current Spending” is primarily direct expenditure for salaries, employee benefits, purchased professional and technical services, purchased property and other services, and supplies. It includes gross school system expenditure for instruction, support services, and noninstructional functions. It excludes expenditure for debt service, capital outlay, and reimbursement to other governments (including other school systems).


