In the first three installments of this series, KPI has thoroughly debunked the Kansas Association of School Boards cry for higher taxes based on what they call “declining investment in school funding.” In Part 1, Dave Trabert challenged KASB’s position that government, specifically schools in this case, has an inherent right to a given percentage of personal income. In Part 2, Patrick Parkes discredited their contention that higher taxes are needed to support an increase in education spending, showing that government already spends more money than is needed. I made the case in Part 3 that their argument for more money is fundamentally flawed, since there is no evidence more spending will lead to higher student achievement. This fourth and final entry will focus on KASB’s misuse of data to support their fallacious case.
Historical data. Tallman picks 1975 as a starting point to make the case that education funding is lacking. Why 1975? Why not 1965? 1981? When reading annual timeline data, one should always be suspicious of the beginning year unless something significant changed to precipitate such a starting point. Is there something special about 1975, or is that just a convenient starting point in which to make a case? What’s doubly troubling about KASB going back to 1975 and analyzing education spending is that according to KSDE, any data prior to 1990 is, at best, an estimate. So when Tallman states “total school district funding in Kansas has averaged a 5.6 percent increase per year since 1975,” that is not a statement that can be backed up with reliable data.
Personal Income. Even if one accepts the ludicrous proposition that schools are inherently entitled to a certain percentage of personal income, KASB’s data and the interpretations are flawed. In Tallman’s words: “school funding has been declining as a percent of personal income (since 2008).” He claims “K-12 funding has averaged 4.6 percent of Kanas personal income since 1975 and topped at 5.0 percent in 2009 and 2010, but is estimated to be 4.4 percent in 2016.” That is a statement that is questionable on several levels. First of all, there’s that 1975 data thing, in which he compares estimates to hard data. Secondly, he doesn’t explain the uptick in spending in 2009 and 2010. That increase had nothing to do with how much Kansans had in terms of personal income; au contraire, education funding was propped up by the federal stimulus package, also known as ARRA. Therein lies the inherent limitation in trying to tie education spending to personal income – other factors, such as a jump in federal dollars can distort the relationship between those two variables as was the case in 2009 and 2010.
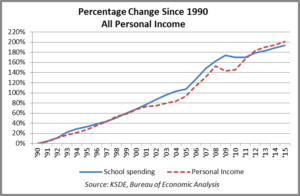
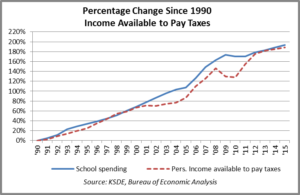
These graphs provide a better picture of the longitudinal relationship between education spending and personal income. They track the two in terms of percentage increase since 1990 using reliable data. Whether it be all personal income (which includes some dollars not available to pay taxes) or simply income available to pay taxes, spending and income have tracked quite closely over the past quarter-century.


Tallman’s contention that there is a critical, growing gap between the citizens of Kansas ability to pay and the actual amount spent on education doesn’t stand up to closer scrutiny.
Record spending continues while student performance lags. Despite the hair-splitting approach KASB takes to make the fallacious case that education spending has decreased, overall education spending continues to set records. Per-pupil spending has settled in north of $13k, with another record spending predicted for the current school year. Even controlling for KPERS spending, 2015-16 was another record year. More importantly, record spending has not produced improved results, a truth that seems to get lost in the debate over funding. The most recent state assessment data from 2016 shows far too many Kansas students continue to fall behind academically. Only one in four of all 10th graders statewide are considered college ready in math, less than one-third are prepared in English language arts (ELA). For low income students, it’s much worse: less than 20% are college ready in ELA and only about one in ten in math.
In the final analysis, the students and taxpayers of Kansas would benefit significantly if KASB and the rest of the education community would put as much focus, effort and evaluation on student achievement as they do in their pursuit of money for money’s sake.


