Kansas education debt, cash on hand and overall spending grew faster than other states in the region and the nation as a whole over the last decade according to recently released U.S. Census data Growth in these categories has also outpaced the inflation rate of 23.4% since 2004.
KPI discovered that Census inadvertently excluded USD 512 Shawnee Mission data from their reported totals for 2014; KSDE and Census officials confirmed our finding. Census will not republish correct data until 2015 data is released but did provide us with revised Kansas data for Tables 1, 8 and 19 of their report. The Kansas and U.S. data in this article come from the revisions provided to us by Census officials.
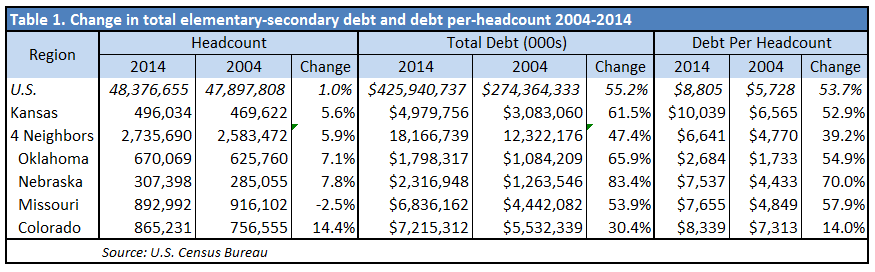
Debt. Table 1 is a summary of debt obligations for 2004 and 2014. In Kansas, total debt increased 61.5% from just over $3 billion to nearly $4.8 billion in 2014. This is slightly higher than the nation as a whole. Although Nebraska and Oklahoma experienced higher percentage changes since 2004, the Kansas debt per student (the Census Bureau uses headcount as their student count) checks in at over $10 thousand and is higher than all the states in the region and is the 7th highest in the nation. As a comparison, Kansas’ debt per student is nearly four times that of Oklahoma.
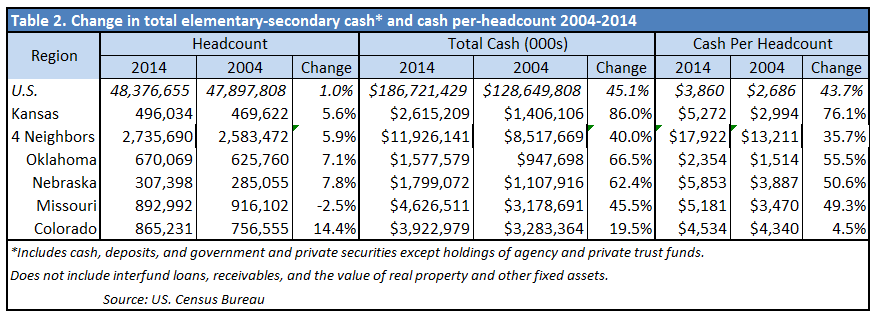
 Cash and securities. The total cash balances reported by Census do not provide breakouts for the amounts held for debt service, capital outlay and operating funds. The Department of Education reported Kansas districts as having $2.6 billion in cash and securities but district reports only reflect $1.7 billion on hand. KSDE has not yet responded to our inquiry on the discrepancy but it doesn’t appear to be a one-time reporting error as KSDE reported much more cash than shown on district reports for each of the last several years. Reported cash carried by Kansas schools increased 86%, far outpacing all other states in the region and the entire country. Table 2 shows the difference is even more pronounced for cash per headcount. While schools across the nation were increasing per-student cash on hand of 43.7%, Kansas schools banked 76.1% more money than ten years previous.
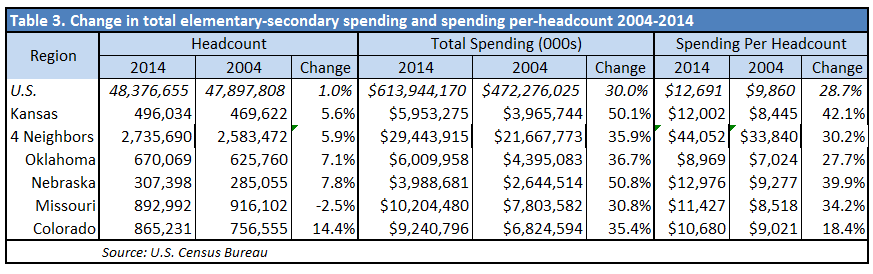
 Spending. Total spending in Kansas climbed 50.1% during the period, surpassing both the U.S. and regional averages. Comparatively, the same is true regarding spending per student headcount. Kansas experienced a 42.1% jump, again above the national and regional averages. Inflation was 24% according to the Bureau of Labor Statistics (CPI, Midwest Urban Cities on a fiscal year basis).
 This data is further evidence of the growth in money to Kansas K-12 education on several levels. In addition, it shows that the overall increase here exceeds that of our region and the nation as a whole. Looking at this data makes it absurd to conclude that somehow Kansas schools are underfunded.