
In January 2021, Kansas Policy Institute released a study comparing how Kansas’s 105 counties differ in their per resident spending. The data at the time was based on 2018 spending: since then, the COVID-19 pandemic has drastically changed how both states and counties spend. The most recent data available from the Kansas Department of Administration’s Municipal Budget Summary Reports provides the actual data for 2022. This article is a follow-up to the original report with those 2022 numbers and more context given Kansas’s current economy.
The Basics – Why does spending matter?
Kansas’s counties differ vastly from rural areas like Cheyenne or Norton to regional population centers like Ford and Finney to the largely urban Sedgwick and Johnson and everywhere in between. These counties differ in the number of citizens they serve, the availability of existing resources, and the cost of creating or providing services. However, the thing that connects these counties is that they must all provide some form of the same basket of services as each other: roads, public safety, administration, etc. Yet, different counties are able to provide the same basket of goods at different prices and qualities than others.
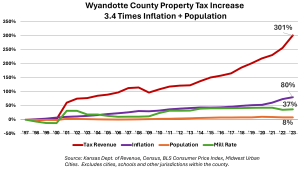
Spending matters for several reasons. Most directly, the amount a county spends determines how much it taxes. For instance, between 1997 and 2023, Wyandotte County’s population increased by 8.2% and inflation was 80.4%, see adjacent graph. However, the property tax paid by Wyandotte County residents ballooned by 301.2%. That difference between the increases in property tax and inflation and population growth was driven by choices in how much the county spent.
As a consequence, taxation is a cost citizens must pay. A rural homestead in Kansas worth $150,000 and in a town the size of Iola has the fourth highest property tax compared to similarly sized towns in the rest of the states. High property taxes are a reason why Kansas has had a net loss of almost 200,000 residents moving to other states since 2000. Every dollar a family pays in taxes is a dollar that isn’t being spent at a local business. Higher taxes discourage local business investment.
In order to be minimally invasive on the bank accounts of their constituents and their local economies, governments need to minimize their taxation, which in turn means right-sizing spending for their community.
State Spending Comparisons
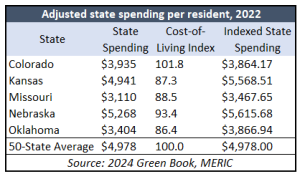
According to the 2024 Green Book, which compiles data from sources like the National Association of State Budget Officers and the U.S. Census Bureau, Kansas spent $4,941 in state dollars per resident. The 50-State Average was $4,978. Since a dollar in Kansas buys more than a dollar in New York of California, the spending can be adjusted based on the Missouri Economic Research and Information Center (MERIC) cost of living index. Accounting for the metric, Kansas has $5,568 in adjusted spending power. The below table shows the spending adjustment for Kansas and its neighboring states. This means that while at first glance it appears to be good news that Kansas spends less than the 50-state average, our actual cost of living-adjusted spending is well beyond our neighboring states and is likely a drag on potential economic growth.
There was a wide disparity between how much low-tax states spent per resident compared to high-tax states. States with no-income tax spent $3,113 per resident while income-taxing states spent $5,517 – a 77% increase. Based on rankings from the Tax Foundation, the 10 states with the lowest tax burden spent $3,283 per resident, but the 10 states with the highest tax burden spent $6,605 – a 101% increase.
The relationship between how much a state spends is directly related to how much it needs to tax: In 2021, Kansas collected an estimated $3,950 per person in state taxes. This was slightly higher than the 50-state total of $3,777 and the total from non-income-taxing states of $2,484. Again, this comes down to two factors: what services the government chooses to provide and how many people the government serves and are thus paying for those services.
Here’s an example: in 2019, California’s state and local governments spent $16,145 per resident while Texas’s only spent $10,024. Over half of the difference between the two states came down to healthcare spending. California spends $4,931 per resident while Texas spends $2,417. California similarly spent twice as much per capita on public safety and retirement programs and four times as much on public transit. Texas spent almost double what California spent on highways.
As a result, the states differ on several metrics. For instance, 7.7% of California’s residents are uninsured compared to Texas’s 18.4%. California’s high spending has caused high property taxes and contributed significantly to some of the highest costs of living in the country. As a result, California has four times the homelessness rate than Texas and has half of the building permits than Texas does. States decide how to allocate their resources and citizens represent how happy they are with them by voting with their feet. According to IRS migration data from 2020-2021, California had a net loss of 331,760 residents to other states while Texas had a net gain of 174,866. When California’s government policies create thousands of dollars worth of costs – including 42% higher health care costs, 48% higher electricity, and 47% higher rent compared to the national average – it’s worth considering whether the policies can be provided at a lower cost.
It’s important to note that the reasons someone moves are numerous and intertwined. Someone moving for a new job is affected by the economy in that state, to say nothing of a county itself, which itself is affected by controllable factors such as government taxes and spending. What may be harder to decipher are less predictable aspects such as business clusters and geographic location. As will be discussed later, Johnson County spends twice as much per resident as Sedgwick County, yet Sedgwick County had a net loss of 174 residents to Johnson County through domestic migration in 2021. Having low spending doesn’t automatically draw residents: it’s the fact that it creates long-term growth through limited government involvement that does. Furthermore, a net of 174 moving to the fastest growing part of the state in both economics and population isn’t unusual. What’s more, as Professor Art Hall discussed in a 2020 KPI paper, the metropolitan areas that attract the most economic opportunity are also typically larger regardless of other factors such as county spending.
Just as with state spending and taxation, the question is one of what a government can control. Kansas cannot wish itself closer to mountains or a beach, nor could Commanche County wish itself closer to the Kansas City Metro. What they can control is how much their spending decisions impact their necessity to tax their residents.
County Spending Comparison, 4 Years Later
In 2022, Kansas’s counties spent a total of $3.34 billion dollars, ranging from a maximum of $766 million in Johnson County to a minimum of $4.98 million in Chautauqua County. Counties across the state variedly widely in how they spent though.
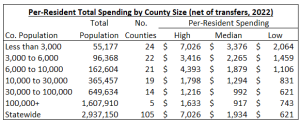
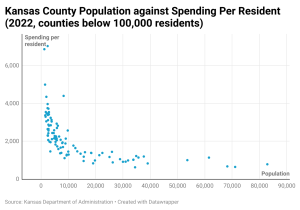
In an attempt to account for size and scale of programs, Kansas’s per-resident county spending shows a different story about spending differences. As population increased across counties, the typical per-resident spending decreased. For instance, the 24 counties with less than 3,000 people in them had a median per-resident spending of $3,376, just over the median of the 22 counties with between 3,000 and 6,000 residents. Similarly, the range between the highest and lowest spending counties increased as county population decreased, On a per-resident basis, Graham County in North Central Kansas spent the most of all counties in the state at $7,026 to serve its 2,411 residents. Yet, Ness County in West Central Kansas spent almost $5,000 less per-resident than Graham to serve its population of 2,645.
Differences like this happen all across the state. Johnson County and Sedgwick County are the two largest in the state with populations of 619,195 and 525,525 respectively. Yet, Sedgwick County spends $743 per resident while Johnson County spends $1,633. If Sedgwick County was spending the same per-resident as Johnson County, it would be spending $467.7 million (119.8%) more across its entire budget. Likewise, if Johnson County was spending the same per-resident as Sedgwick County, then its budget would be $551.1 million (54.4%) less than it is now.
The differences between the two counties are everywhere. Sedgwick County spent $3 million on 911 services in 2022 while Johnson County spent $6 million. Sedgwick spent $2.7 million on Storm Drainage while Johnson spent $16.2 million from their Stormwater Fund. Johnson County’s General Fund spending of $542 million dwarfed Sedgwick County’s at $233 million. Each county may slightly categorize their expenditures in different ways, but looking with a broad scope, there’s sizable differences as part of why Johnson County spends over double as much per resident as Sedgwick County. Not only are the differences in expenditure categories, there are likely differences in the services a county delivers. Some counties split road maintenance responsibilities with townships, while others pick up the burden by themselves. The point of compiling and evaluating the topline number is to begin asking questions about “why” spending differs.
In 2018, Kansas counties spent $2.20 billion in their funds: since then, spending has ballooned statewide by 51.8%, but statewide population has only gone up by 28,374, less than a 1% increase. The median per-resident spending across all counties for 2022 is $478 higher than what it was for 2018. The same trends about the range of and size of per-resident spending in smaller population counties remains similar though. Though the direct reason for increases in each county is unclear, high inflation and increased government spending through the COVID-19 pandemic are possible reasons. Much of the COVID-era money that came from the federal government was one-time money and, while largely unneeded, should have been treated as such. If governments decided to use that one-time money to fund on-going programs they will likely have made a serious mistake with long-term repercussions. This phenomenon is not unique to county spending but is something that states, school districts, and other around this country have been forced to reckon with. As we get further from the pandemic itself, the spending deadlines on the numerous COVID-era programs expire, and spending “returns to normal” we’ll begin to understand how prudent were the decisions on county governments.
One point shines through the data. Counties of similar size can operate at significantly different, read lower, spending levels, yet provide the same basket of services as other counties. As with the comparison between Johnson County and Sedgwick County above, there has to be room amongst the hundreds of millions of dollars that Johnson County spends to bring it closer to the levels of Sedgwick County.
How Counties Can Save Money
Cutting spending shouldn’t be a measure of hacking and slashing away programs from the budget, but rather a continuous effort to identify waste or reduce budgets. At the national level, the Government Accountability Office (GAO) has thousands of recommendations made across both Democratic and Republican administrations on how to reduce costs.
Some are massive and unlikely to happen – one of the Trump Administration’s recommendations was the full repeal of the Affordable Care Act, which is unlikely to happen. However, most of them are small improvements that, when done together, add up over time. For instance, in May 2024, the Department of the Interior added a series of recommendations for their organization such as improved management of their IT acquisitions to prevent projects from running over schedule or having little effect on outcomes. The Department of Transportation suggested better planning with regard to the implementation of automated vehicles to prevent purchases from being made without goals in mind.
It doesn’t take an independent office for county officials to sit down, examine their finances, and identify areas where spending could be improved. Every function of government has the opportunity to be more efficient. At the state level, performance-based budgeting requires all agencies to identify goals for their programs and report on their progress, or lack thereof, with an aim to drive appropriation decisions. The structure of performance-based budgeting can easily be replicated at the local level. Several simple reforms done across a county would almost certainly add up in savings for taxpayers quickly.
Personnel costs make up 70% or more of most county governments. Instead of layoffs or pay freezes, counties have several ways to reduce costs. When a position naturally vacates when someone leaves, the county could evaluate how its responsibilities could be divided amongst other roles, or if that position is even needed given changing technology and citizen needs. For instance, finding more affordable ways to provide healthcare can reduce the county burden. In 2023, Kansas’s top overtime earner was a Sedgwick County Detention Deputy who made $156,156 out of a $246,261 salary: finding ways to address high overtime pay could also balance out the budget and reduce the workload of employees.
Incentives could also be included for the government employees who remain. Suppose a county administrative employee retires and their total cost of employment (i.e., wages, health care, retirement) was $100,000 per year. Simply stated, return $50,000 to taxpayers and use the remaining $50,000 for salary increases, technology investments, or otherwise let it “stay” in county coffers.
A Look Forward
Kansas has the 3rd highest number of general purpose governments per resident in the country: that is, for every 1,475 of Kansas’s 2.9 million residents, there’s a city, county, or township taxing and spending them. After Wyoming, Kansas has the second-highest number of local government employees per resident in the country. Kansans are overgoverned – and as a result, face higher taxes.
Controlling spending is the way governments ranging from small towns to urban counties to the State of Kansas can reduce its tax burden and create more opportunities for its residents to prosper. Counties of similar sizes differ drastically when it comes to their per resident-spending: there’s room across all of government for changes that add up and make a difference.


