The U.S. Department of Education just released results of the 2015 National Assessment of Education Progress (NAEP). The results, also known as “the nation’s report card,” is administered to a statistically valid sample of fourth and eighth graders from every state in math and reading every two years.
How did Kansas do? Well, if I had brought home a report card like this in grade school I would have been grounded. As a high school student my mother would have taken away my driving privileges.
Math scores for both 4th and 8th graders tumbled precipitously, reading scores were virtually unchanged, achievement gaps remained essentially stagnant, and Kansas dropped alarmingly in most categories relative to the rest of the states.
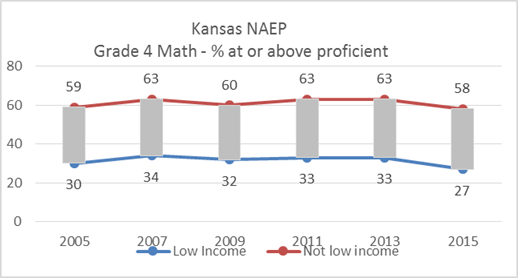
Math scores
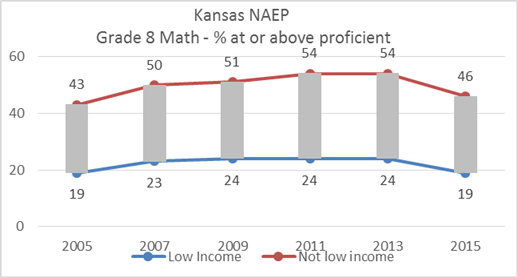
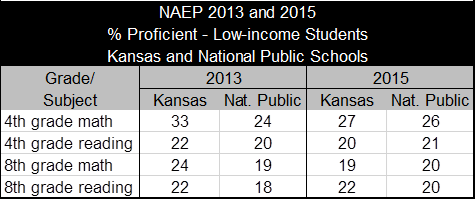
The following graphs tell the story: the percentages of students at or above proficient level in math in both 4th and 8th grades dropped significantly in 2015, both for low-income and not-low-income groups. After several years with flat results, fourth graders fell to the point that they tested lower than in 2005, a full decade ago. The percentage of not-low-income eighth graders who tested proficient is now less than half, while less than one-in-five low-income students are proficient in math.
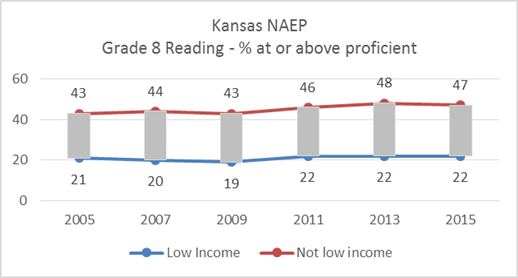
Reading scores
In grade four, gradual improvement in reading scores over the last decade by the not-low-income students was halted, while low-income students continue to remain virtually unchanged since 2005. Eighth graders’ scores for both income levels remain stagnant, also with little change over the last ten years. Even more disheartening is that less than half not-low-income students in eighth grade are proficient in reading, while proficient low-income students remains at about one-fifth.

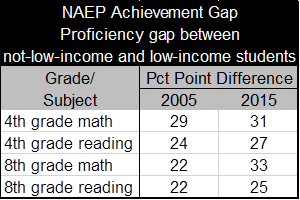
Achievement gaps
The above graphs confirm the never ending story of achievement gaps along income lines. The table below shows how achievement gaps continue to be greater in all four grade/subject categories in 2015 than in 2005.
Kansas compared to the nation and the states
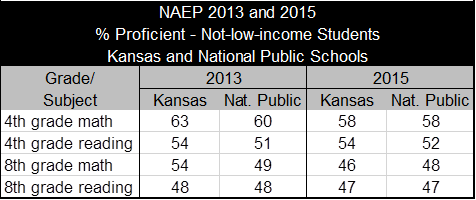
Perhaps the most startling result is how far Kansas dropped relative to the rest of the nation in overall scores. The first table below shows that from 2013 to 2015 the percentage of low-income students nationally who tested proficient went up in all four categories, while in Kansas the percentage dropped in all but 8thgrade reading, which remained unchanged. Regarding the not-low-income students, Kansas has also slipped vis-à-vis the nation, as revealed in the second table below. Over the past decade, Kansas had been consistently outpacing the rest of the nation. As recent as 2013, the not-low-income Kansans tested above the national average in all four categories. Now, only 4th grade reading scores beat the national average.
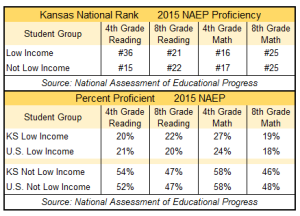
The table below provides a picture of how both income groups rank among the states. Taken in total from these tables, a picture emerges that Kansas achieves about average in a nation that doesn’t perform very well.
Explaining the results
Are these scores just an anomaly, or are they the beginning of a new trend? It’s important to note that not only Kansas experienced lower outcomes. According to Education Week, the raw composite math scores that are the basis for placing students into the proficiency categories in the above graphs showed a statistically significant drop in both grades. In reading, 4th grade was unchanged, but 8th grade scores nationwide fell a statistically significant amount.
Obviously, one outcome does not make a trend, but certainly these results raise questions as to what happened. Not surprisingly, the education community had no shortage of excuses for the lower performance. Chris Minnich, the executive director of the Council of Chief State School Officers said, “There was a lot going on in this country around testing and transition.” Randi Weingarten, president of the American Federation of Teachers, blamed it on too much focus on “test scores and their consequences.” Former Department of Education Secretary Arne Duncan called it an “implementation dip.” Even those outside the establishment chimed in. Michael Petrilli, president of the Thomas B. Fordham Institute said in this blog that the fault lies in the economy. He said: “[W]hen families are hurting financially, it’s harder for students to focus on learning.”
I believe the most plausible explanation is a variation from a statement by William J. Bushaw, the executive director of the National Assessment Governing Board which sets policy for NAEP. He used the term “curricular uncertainty” in describing how states are having trouble aligning curriculum to meet Common Core Standards. I’d take that statement a step farther by offering evidence that most curriculum simply does not align with Common Core. That means it’s no surprise that since NAEP and Common Core “have a ‘reasonable’ overlap”, there is a decline in scores across the nation.
Among the plethora of reasons to dump Common Core Standards, a new one can be added: lower performance on NAEP scores.