Total K-12 education expenditures for the 2019-20 school year topped the $7 billion mark according to the latest financial figures released by KSDE. Per-pupil expenditures rose 5.42% to $14,848. (KSDE just estimated 2020-21 total spending at $7.3 billion and per-pupil at $16,216.) Of the $7 billion spent in 2019-20, just over $2.1 billion came directly from the number of students (FTEs) multiplied by the base state aid (known as BASE- base aid for student excellence). In 2019-20 FTE enrollment was 476,454.3 with a BASE of $4,436. That leaves another $5 billion that came from other sources.
In my last two articles, I pointed out how the funding system allows for some of that money to be generated for students who literally do not exist. In this article, I describe each of the weightings that are based on individual characteristics of students and disclose how much additional funding student weightings provide for districts – another piece of the overall finance formula and part of the $7 billion-plus districts spend.
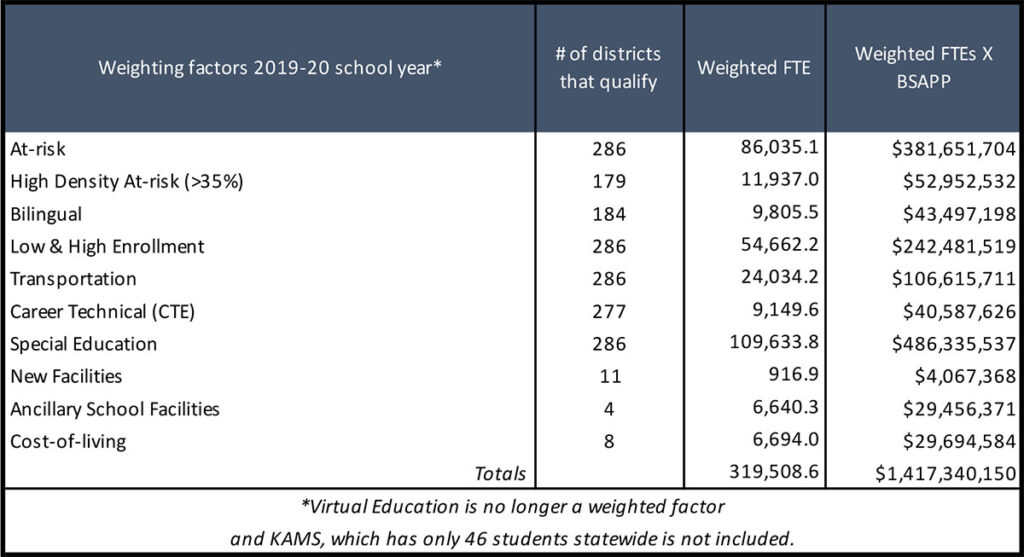
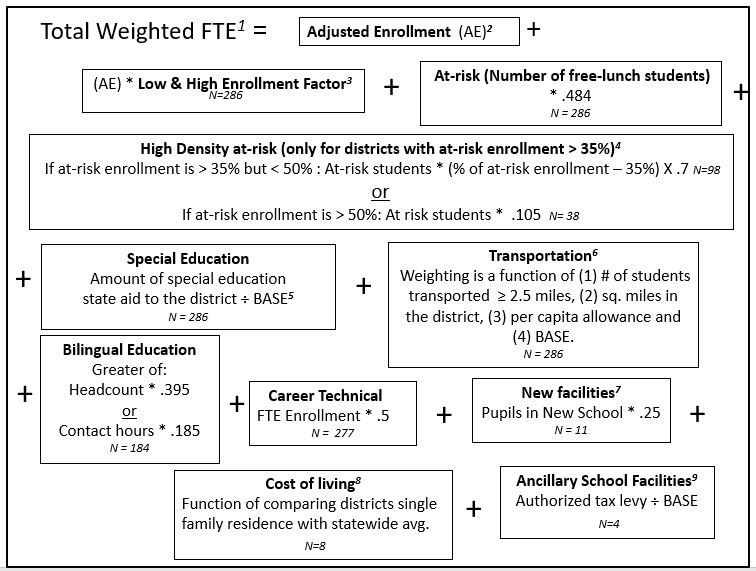
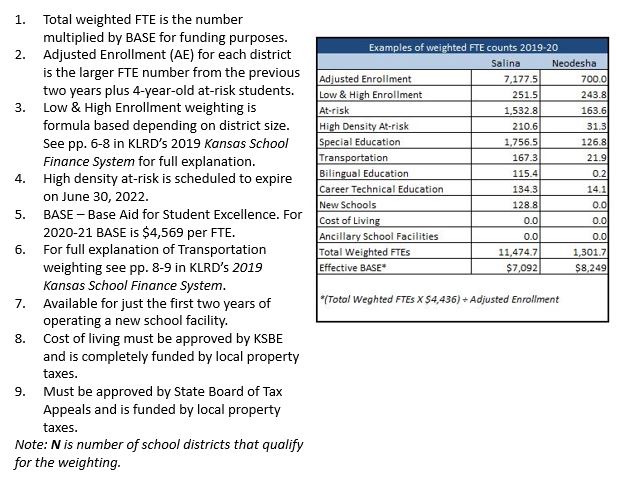
Needless to say, the K-12 school funding formula is both complex and complicated. The portion that allows students to be weighted based on certain characteristics in order for districts to receive additional funding is Exhibit A. There are essentially 10 weighting categories, those listed in the table below. Each of the categories has a unique formula for determining how many “additional” students are added for funding purposes. Each is described in some detail in the weightings formula flow chart and notes at the end of the article.
Let’s look at the at-risk weightings for example. All 286 districts have at-risk students – at-risk is defined in Kansas as those who qualify for free lunch through the school lunch program. The number of at-risk students is multiplied by a weighting of 0.484. That product is multiplied by the BASE to determine how much money the districts receive to provides services – at least in theory – to those who are academically at-risk. There is another at-risk weighting which applies to districts that have an at-risk population that is at least 35% of the total student population. The formula flow chart explains how that works.
According to the table, the two at-risk categories added nearly 98,000 weighted FTEs in 2019-20. That translates into an additional $434 million to the districts. All told, the 10 weightings listed below accounted for over $1.4 billion to the districts last school year.
A couple of important notes:
- That amount includes the Low & High Enrollment weighting featured in this article.
- The weightings for transportation and special education do not include additional state aid for those two functions. The state provided approximately $100 million in non-weighted transportation aid and over $486 million in non-weighted special education support last year.
- A small weighting for students in the Kansas Academy of Math and Science (KAMS) is not included. Only 46 students were enrolled statewide in 2019-20.
- Aid for virtual students is not included. Virtual aid is no longer weighted; it is funded by a flat amount based on student enrollment status.
Combining the $2.1 billion generated from FTEs X BASE with the $1.4 billion from the weightings, that adds to about $3.5 billion, or half the $7 billion spent last year from all sources – state, local and federal. Where does the rest come from? That will be the subject of the next article. Stay tuned.