You can add ‘misleading the Kansas Advisory Council to the U.S. Civil Rights Commission’ to the list of ethical lapses committed by educators in their pursuit of money. The Advisory Council took testimony earlier this year to determine whether the Kansas school funding formula contributes to disparities in student achievement on the basis of race, color, sex, national origin, disability status, or religion.
Educators who testified could have saved the civil rights advisory council members a lot of time by simply stating that funding isn’t distributed on the basis of race, color, sex, national origin, or religion, so the formula cannot be discriminating by design. (Additional funding is provided for students with disabilities.) Instead, council members were subjected to a steady stream of misleading and false claims designed to elicit support for more money.
The Advisory Council to the civil rights commission hasn’t reported its findings at this writing, but it will hopefully see through the shams and conclude that any discrimination in the application of resources is by choice of local school boards and administrators rather than the structure of the school finance formula.
Advisory Council member Mark Dodd commented, “…it’s not the formula. It is the lack of accountability. So it is where they’re using money, not the distribution of money from the state, not the amount of money.”
Mr. Dodd is correct. It’s how money is spent that can make a difference rather than how much is spent. The application of money is at the control of local school boards. And Mr. Dodd wasn’t the only advisory council member who noted conflicting testimony. Several members commented on the disparate claims of funding being cut and funding setting new records (full disclosure – I was one those testifying that funding had actually increased). The Advisory Council invited Department of Education Deputy Commissioner Dale Dennis to testify on whether funding was cut or increased, but he declined, saying he was busy and had nothing to add. Translation: it would be impolitic to confirm that his allies had fibbed about funding cuts.
Some of the more egregious examples of false and misleading testimony follow, taken from transcripts of the hearings and listed in sequential order. To be clear, testimony not addressed here should not be assumed to be accurate; these examples are simply the most appallingly inaccurate and misleading.
Tiffany Anderson, Superintendent of USD 501 Topeka
Ms. Anderson said districts, “…are currently receiving less base state aid per pupil than they were in fiscal year 2006.” While technically true, Ms. Anderson failed to mention that other forms of discretionary and/or largely discretionary state aid have increased significantly. It’s like a child saying her weekly allowance of 12 quarters ($3) hadn’t increased, even though it’s now 12 quarters and 30 dimes ($6).
She also falsely claimed that, “…special education student weightings have been calculated from a dwindling base aid per pupil, meaning that Topeka Public Schools is currently receiving the same amount of state aid per special education student as it was in 2002 without any adjustment for inflation.” According to Department of Education Deputy Commissioner Dale Dennis, “…special education state aid statutes are primarily found in KSA 72-3422, 72-3425, and 72-3440” and it would be “inaccurate” for someone to say special education aid is a factor of just Base State Aid.
Jason Strickland, Assistant Superintendent of USD 500 Kansas City
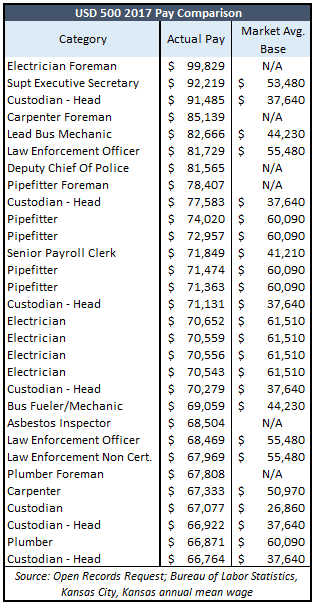
Mr. Strickland said, “…if districts…do not have access to funds that allow for them to pay their staff competitive wages, well then they do not have access to the highest quality teachers.” This specious statement is particularly galling given that a July 2013 efficiency audit called out his district for paying some non-teaching staff as much as 30 percent above market wages.
 And that practice continues, as shown on the adjacent table. In fact, USD 500 had plenty of money to pay some custodians and secretaries more than twice the market average last year.
Keep in mind that the pay differentials shown here don’t include benefits; government benefits for insurance, retirement and paid leave are much more lucrative than private sector benefits.
Whether some of these positions should even exist is another important issue. Most school districts don’t employ electricians, carpenters, painters, pipefitters or plumbers; when those services are needed, they’re contracted in the private sector.
A 2017 payroll analysis also disclosed a startling emphasis on non-teaching positions. Total pay for the Kansas City school district increased by 3.8 percent to $168.8 million but teachers saw very little increase. Collectively, those identified by the district as teachers saw their pay increase by just 1.4 percent, while pay for all other district employees jumped by an average of 6.8 percent.
Anna Stubblefield, Deputy Superintendent of USD 497 Lawrence
Ms. Stubblefield said, “Funding cuts in recent years have made it difficult for our district to make academic progress” but there were no recent funding cuts. Per-pupil funding of Kansas schools actually set new records every year since 2013 with one exception; there was a tiny decline in 2016 because the Legislature delayed some pension payments, but that also means schools’ expenses declined by the same amount.
She also said the district had spent down its cash reserves, and while there’s an element of truth to her claim, it’s also quite misleading. The district had $5.7 million in operating cash reserves in 2005; they diverted money provided to educate students and boosted total operating reserves to $35.9 million by 2014 and then spent it down to $20.2 million in 2017. Reserves are down from their record high but almost four times higher as in 2005.
Terrell Davis, Executive Director of Public Affairs for USD 259 Wichita
Mr. Davis said the district “…cut $98 million since 2006…” from their budget, and those not trained in government-speak might think that means the district is spending $98 million less. But most often, government means it got a small spending increase than it wanted when saying the budget was ‘cut.’ In fact, the Wichita district spent $148 million more in 2017 than in 2006, and it budgeted a $64 million increase for the 2018 school year.
He also gave false testimony about the district’s operating cash reserves, claiming that the $100 million total for 2017 included money set aside for bond payments, which couldn’t be used for operating costs. Data provided by the Kansas Department of Education shows the district had another $38 million set aside for bond payments and $21.7 million for capital projects in addition to the $100 million for operating costs.
Ann Mah, State School Board member
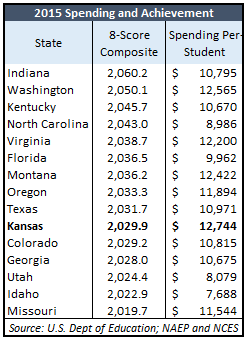
Ms. Mah (falsely) boasted, “No state spends less per pupil than we do and gets better test scores than we do.” Well, except for Indiana, Washington, Kentucky, North Carolina, Virginia, Florida, Montana, Oregon and Texas. On average, they spend $1,600 per-student less and have better outcomes on the National Assessment of Educational Progress (NAEP). And then there’s Colorado, Georgia, Utah, and Idaho that get virtually the same results while spending $3,000 per-student (average) less than Kansas.
 2015 is the most recent year for which spending and test scores can be compared. The adjacent table compares the 8-score NAEP composite with per-student spending amounts provided by the National Center for Education Statistics.
The 8-score composite is the sum of test scores in Reading and Math for Low Income students and those who are Not Low Income in the 4th Grade and the 8th Grade. For perspective, NAEP says 10 points of change is the equivalent of a year’s worth of learning, so an 80-point variance on the 8-score composite would approximate a year’s worth of learning.
Indiana’s score was about 30 points higher than Kansas while spending almost $2,000 less per-pupil. Most remarkably, North Carolina was about 13 points higher while spending over $3,700 less per-pupil.
The point of Ms. Mah’s preposterous claim, often repeated by other educators, is that more money causes achievement to improve and therefore, failure to improve means schools are underfunded.
Ms. Mah, who is a former legislator, also told members of the civil rights advisory council that “…recently the legislature included KPERS [pension] funds into spending, and that greatly inflated the spending.” But that’s not true. KPERS pension funding has been included in reported school funding totals since 2005.
Patrick Woods, school board member of USD 501 Topeka
Mr. Woods implied that the Legislature’s audit division produced a 2006 recommendation to increase school funding, saying it “came back with about a $500 million price tag….” But page 2 of that study very plainly says, “…it’s important to remember that these cost studies are intended to help the Legislature decide appropriate funding levels for K-12 public education. They aren’t intended to dictate any specific funding level, and shouldn’t be viewed that way.” The next paragraph disclosed other critical information that educators like to ignore; “Finally, within these cost studies we weren’t directed to, nor did we try to, examine the most cost-effective way for Kansas school districts to be organized and operated.”
Emily Rauscher, University of Kansas and Kaye Monk-Morgan, Wichita State University
Two Kansas university professors also presented testimony, and both of them made undocumented claims.
Emily Rauscher said school funding was about 10 percent below its 2008 level, but the Department of Education estimated 2018 per-pupil funding would be about 12 percent higher than in 2008; she also referenced Patrick Woods’ [false] claim of large funding cuts since 2008. Additionally, Ms. Rauscher made this statement but declined my request for documentation to support it: “For a $1,000 decrease in instructional spending per student, the white/black gap in achievement increased by about one-quarter of a grade level, and I also find that Hispanic achievement declined substantially, and significantly. In terms of high school graduation rates, a $1,000 decrease in average funding per student over the four-year high school career is related to a significant increase in the white Hispanic gap in graduation rates.”
Even though Ms. Rauscher provided no documentation, her thesis (provide more funding to improve outcomes) is fundamentally flawed by design. Legislators who approve funding levels have no control over ‘instructional spending;’ the amount allocated to instruction or any other function is strictly at the whim of local school boards, so there’s no guarantee that more funding will actually be used on instruction.
Kaye Monk-Morgan made a number of intimations regarding the relationship between spending and achievement, as well as “…the disparity with regard to funding…,” but she also failed to provide any data to support her contentions upon request. She made numerous references to ‘cuts’ in services – even identifying lack of specific programs at certain schools – but doesn’t seem to understand that funding was not cut or that any program cuts were by choice of local school districts.
Conclusion
It’s entirely possible that some of the presenters may not have been aware that they were providing false or misleading testimony to the civil rights panel, but there’s no excuse for educators merely repeating what they’ve been told. There’s no question, however, that some of the testimony was consciously misleading.
The real shame is that this process was used by many educators to pursue their quest for more money without regard for students’ educational interests. Educators and administrators will continue to twist the facts and abuse the truth to get what they want, until leadership in Kansas is willing see through their self-seeking narrative and put student achievement first.


