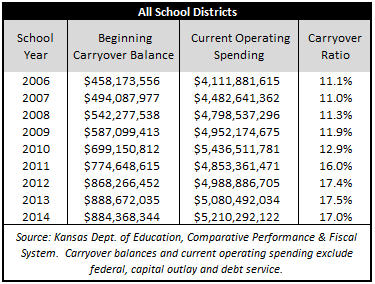
School districts may say they need their cash reserves to operate but if they each had maintained the same percentage of operating expense held in 2006, cash reserves would have been $320 million lower at the beginning of the 2014 school year.
 Most school districts claiming to have small cash reserves are only talking about their Contingency Fund, which is often referred to as a savings account for emergencies. In reality, they have as many as twenty-eight funds functioning in that fashion. Districts collectively began the 2014 school year with $194 million in Contingency cash reserves but their current operating carryover cash reserves in those twenty-eight funds totaled $884 million.
KPI staff calculates an annual Carryover Ratio for each district to facilitate cash reserves comparisons of districts of all sizes and spending levels. The Carryover Ratio reflects each district’s carryover cash reserves at the beginning of each school year as a percentage of that year’s actual current operating spending.
The 2014 Carryover Ratio for all school districts was 17percent ($884 million in cash reserves divided by $5.2 billion in current operating spending. As shown on the adjacent table, the Carryover Ratio is significantly higher than in most years. The average Carryover Ratio was very steady between 2006 and 2008; it increased a bit more over the next two years and then took a large jump in 2011 to 16 percent.
This trend is quite significant for purposes of determining adequacy of funding and the necessary level of cash reserves. School funds operate on a cash basis and are similar to one’s checking account; the balance only increases if more money is deposited than is spent. The annual increase in cash reserves therefore reflect money that districts collected during the year but didn’t need. A one-year increase could possibly be attributed to some unusual circumstance but seven consecutive years of increasing cash reserves is a clear sign that districts have received more money than necessary to educate students. The total increase between the 2006 and 2013 school years was $426 million – that wasn’t needed to educate students. Districts claim that they need their annual cash balances, and to be sure, every entity needs some degree of reserves. However, there is no record of districts complaining that they lacked sufficient cash reserves when average ratios were below 12 percent and since school officials aren’t bashful about claiming to need more money, their silence in those years is quite telling.
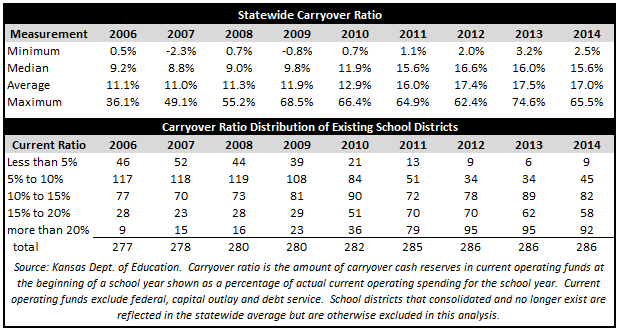
The rise in the median and maximum carryover ratio is even greater than the jump in the average ratio. The median Carryover Ratio rose from 9.2 percent in 2006 to 15.6 percent last year and the maximum carryover ratio nearly doubled to 65.5 percent.

The distribution across districts is also eye-opening. The majority of districts held less than 10 percent of their annual operating costs in reserve through 2009. Since 2011, the majority held more than 15 percent in reserve
Fifty-four districts began last year with less than 10 percent in reserves, which for most of the past several years was commonplace. Indeed, sixty-two districts had less than 10 percent in reserves for at least six of the last nine years. If that many districts can manage operations with small reserves (as the majority of districts have done for many years), it begs credulity that so many districts claim to need more than 20 percent.
Historic Carryover Ratios by district can be found on KansasOpenGov.org.


