Recently KPI published this article that outlined how school districts will not face financial consequences if there is lower enrollment due to COVID, or any other reason. The deck is stacked in financial favor of the districts because they are allowed to take the higher enrollment of the two years previous to the current year. That would be either the 2018-19 or the 2019-20 school years.
However, that is not the only way districts get more money to educate students who aren’t there. There is an additional enrollment premium called Low & High Enrollment. Under Low & High Enrollment every school district’s enrollment is adjusted upward, based on school size (see explanation and formulas here). The adjusted number of “students” is a part of the total FTEs that gets multiplied by the base state aid amount (this year set at $4,569 per pupil).
Understand that Low & High Enrollment premium is not to be confused with other weightings that are based on individual student characteristics (e.g., at-risk, ELL, and transportation, among others – those will be the subject of the next in the series). Low & High Enrollment could be categorized as “just because” money. And these bonus dollars have been part of the education finance formula for decades.
The following tables show the financial impacts of the Low & High Enrollment allowance. The first shows the effect on two districts that I taught in – Garnett (USD 365) and Topeka (USD 501). Apologies for being a little wonky in describing the flow of the calculus, but it’s exactly that wonkiness that gets literally hundreds of millions of dollars a year to public education in methods that are usually overlooked.
Looking at the Garnett example in Table 1, see that the district had an actual FTE count of 953.1 students in 2019-20. However, with the “last two years” rule they were funded as if there were 997.5 FTEs. Added to that number is an additional 246 FTEs generated through the Low & High Enrollment premium. That means USD 365 received base state aid for 1,243.5 FTEs. That calculates to nearly an additional $1.3 million to educate students who simply do not exist. For USD 501, the formula added an additional 956 “students” which means Topeka Public Schools received $4,240,816 for non-existent pupils.
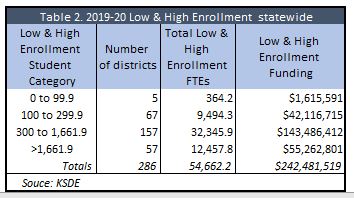
 Table 2 is a summary of the statewide impact from the Low & High Enrollment factor. The 286 districts are in four separate categories for Low & High Enrollment purposes based on school size: under 100; 100 to 299.9; 300 to 1,661.9; and 1,662 and up. Each category has a different formula for determining bonus FTEs.
 The important takeaway is that the Low & High Enrollment allowance added 54,662.2 FTEs to the statewide
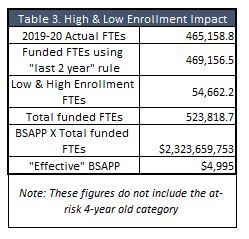
  financial roles, despite existing only in pixels. That means over $242 million dollars were generated for school districts to educate these non-existent students. With the extra $17.7 million from the “last two years” rule outlined in the last article, taxpayers ponied up nearly $260 million in base state aid to educate phantoms. This means the effective base state aid per pupil, as calculated in the adjoining table, was not $4,436 in 2019-20. It was actually $4,995.
The purpose here is not to state that districts shouldn’t have the money. The point here is to show part of the bigger picture of the many different factors in the funding formula that contribute to the schools’ total financial package. Total per-pupil funding is now nearly $15,000 per year. That is more than triple base state aid, which is typically the factor of focus in school finance debate.
The education lobby likes to point only to base state aid as their perpetual complaint of being underfunded. In reality, there is now more than $10,000 per pupil outside base state aid. That additional $10k has got to come from somewhere, and the Low & High Enrollment premium is one of those factors, part of a complex and complicated system that once again serves the institution and not individual students.
Coming next: Additional weightings based on individual student characteristics.


