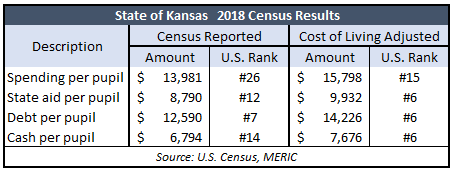
The 2018 Public Education Finance data from the U.S. Census again confirms Einstein’s definition of insanity: doing the same thing over and over again but expecting a different result. Spending per pupil increased by 3.8% nationwide – more than twice the rate of inflation – but achievement is flat or down in most states. Per-pupil spending jumped 5.8% in Kansas, to $13,981, based on headcount enrollment.
But a dollar spent in Kansas buys a lot more than a dollar in New York or California. Kansas has the 6th lowest cost of living in 2019 according to the Missouri Economic Research and Information Center (MERIC).
 Adjusted for the cost of living, Kansas has the 15th highest spending per pupil, at $15,798; the national average is $14,824. Kansas has the 6th highest state aid at $9,932 per pupil, which is more than 40% higher than the national average of $6,930.
Kansas also is ranked #6 for cost-of-living-adjusted debt per student ($14,226) and cash per student ($7,676.)
Low productivity in achievement
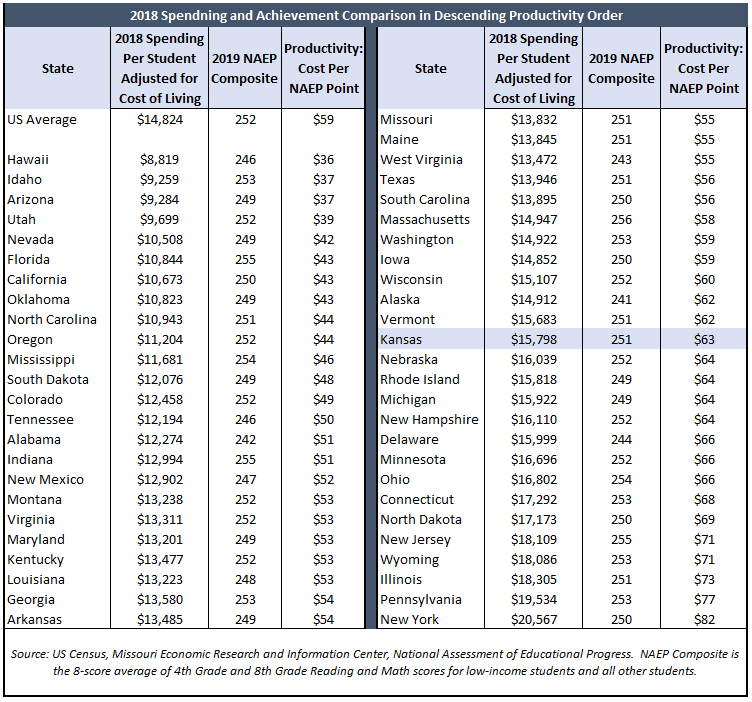
Kansas has high national rankings on spending but achievement on the National Assessment of Educational Progress – the gold standard of comparing states – is exactly in the middle. Kansas’ composite score of 251 is the median for the eight main measurements (4th grade and 8th grade reading and math for low-income students and everyone else).
We can measure each state’s relative productivity – what some might call ‘bang for the buck’ – by dividing the NAEP score into per-student spending to find the cost per point scored.
With COL-adjusted spending at $15,798 per student, Kansas is spending $63 per NAEP point. That’s worse than the national average of $59 per point and places Kansas at #36 on the productivity ranking.
 Once again, the data disproves the notion that spending more money is the key to having better achievement. Six other states have a 251 composite like Kansas. North Carolina spent the least at $10,943; Kansas spent $15,798 and Illinois spent the most, at $18,305. New York and California have the same score (250), but New York achieved it at $20,567 per student while California spent just $10,673.
The Kansas Association of School Boards may claim the state’s public school districts are in the top ten for achievement, but that’s never been true; Kansas’ NAEP rankings range from the high teens to the low 30s, and the 8-score composite is smack at the median. ACT demographic scores are also in the mid-20s.
That ‘bang for the buck’ they like to claim also isn’t true, and it will only get worse as spending continues to rise while achievement remains stubbornly low – or even declining – as it has for many years.


