Our 2018 Voter Issue Guide lists five critical issues that should be at the forefront of policy discussions in Kansas. This article provides a deeper examination of the school efficiency challenge, which is the third of five issues covered in the 2018 Voter Issue Guide. The first installment discussed the $3.7 billion budget shortfall and the second installment addressed student achievement issues.
Over half the state budget is already spent on K-12 education and school lawyers still aren’t happy with the roughly $1 billion increase that has opened a $3.7 billion budget shortfall over the next four years. Education officials have resisted efforts to have schools spend more efficiently and effectively, but the continued price of resistance is steep. Until local school boards and administrators are compelled to spend money more efficiently and effectively, students will be underserved, citizens will be overtaxed and, as school attorney Alan Rupe said, “…other services…may have to suffer.”
Whoever is elected governor and to the Kansas House of Representatives this fall will have look for ways to improve student achievement, and citizens deserve to know the issue exists and how legislators intend to resolve it. Kansas Policy Institute does not support or oppose candidates for public office, but we do provide educational information to the public about key economic and education issues facing Kansans. Our 2018 Voter Issue Guide is intended to arm readers with facts and key questions to consider so each reader can be better informed on the issues.
Efficiency defined
There are two very different ways to measure efficiency. An input measurement focuses on getting the best possible price for the same or better quality product or service. An output measurement, often called cost-per-unit-of-output, compares spending to some form of achievement.
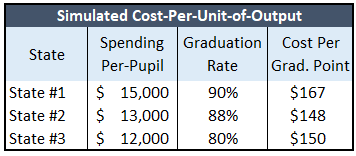
Here’s a simple explanation of an output efficiency measurement, comparing per-pupil spending and high school  graduation rates of three states. State #1 spends $15,000 per-pupil and has a 90 percent graduation rate, so it’s cost-per-graduation-point is $167 ($15,000 divided by 90). State #3 spends the least ($12,000 per-pupil) and its 80 percent graduation rate results in a $150 cost-per-point. But State #2 is the most efficient of the three, spending $13,000 per-pupil and having a $148 cost per-point with its 88 percent graduation rate.
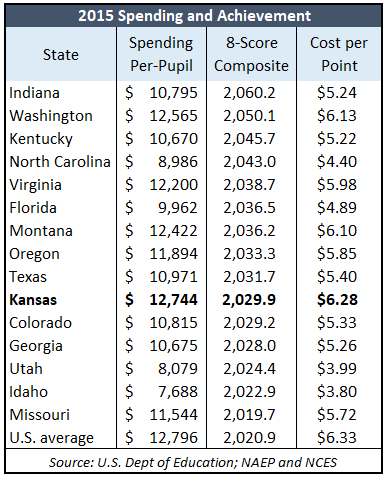
Now let’s look at a real-life example, using data from the U.S. Department of Education. The adjacent table compares per-student spending to an 8-score composite of the National Assessment of Educational Progress scores (Reading and Math for 4th Grade and 8th Grade, for low income students and all other students) to calculate the ‘cost’ of each point on the 8-score composite.
 Kansas spent $12,744 per-pupil in 2015 and had an 8-score composite of 2,029.9; spending divided by score, therefore, means Kansas spent $6.28 for each point of its composite score. The U.S. average was $6.33 per point ($12,796 per-student and 2,020.9 composite). Kansas’ score is a little above average but spending per-student is a little below average, so it’s slightly more efficient than the nation.
The states selected for comparison to Kansas in the adjacent table are those that spent less and had better outcomes or that spent less and had nearly the same results.
Nine states (Indiana, Washington, Kentucky, North Carolina, Virginia, Florida, Montana, Oregon and Texas) did better than Kansas while spending less, and five states (Colorado, Georgia, Utah, Idaho and Missouri) spent a lot loss but received very similar results.
Idaho is the most efficient on this measure, at $3.80 per point and Kansas is the least efficient of these 15 states at $6.28 per point. (Alaska is the least efficient of all states at $11.45 per point.)
Kansas schools aren’t efficient
Whether measured on inputs or outputs, Kansas school districts are not efficient. The WestEd cost study introduced during the school funding lawsuit found Kansas schools to be efficient on an output measurement, not inputs. The authors didn’t specify which outputs they considered but their finding is predicated upon a false premise. WestEd says “…buildings were producing nearly 96 percent of their potential output, on average.” The false premise is that they believe outcomes are determined by the amount spent; as they explain in Technical Appendix A of their report, a cost function “…specifies the minimum cost necessary to achieve certain outcomes.” Accordingly, they believe the potential output of a building is limited based on spending. Hence, their declaration that buildings are producing a certain percentage of potential output.
The above table showing the cost-per-NAEP-point of Kansas and other states demonstrates the absurdity of WestEd’s belief. Texas and the other eight states spending a lot less than Kansas couldn’t possibly get better outcomes if potential output was limited by spending.
Kansas may be a little more efficient than the U.S. average on NAEP scores but there is still enormous room for improvement.
Kansas school districts also have significant opportunities to improve input efficiency – getting a better price for the same or better quality of product or service. Every Legislative Post Audit study on school efficiency has cited many ways districts could reduce costs. Superintendents even told the K-12 Student Achievement and Efficiency Commission that they routinely choose to spend more than necessary and should be able to do so.
Opportunities to Improve
With 286 school districts averaging about 1,650 students per district, Kansas has a lot of redundancy in accounting, payroll, food service, transportation, human resources, purchasing, etc. The services need to be provided to every district but they could be much more efficiently provided through regional service centers, and the savings could be used to improve instruction and teacher pay.
Legislators could also require school districts to utilize statewide bulk purchasing pricing unless better prices can be obtained elsewhere. Outright bans on spending taxpayer money on things such as lobbying or hiring attorneys to sue for more funding are also considerations.
Effectiveness could be improved by getting a larger portion of spending dedicated to Instruction, defined as direct interaction between students and teachers by the Department of Education. In the 2005 school year, local school boards allocated about 54 percent of all spending to Instruction; it declined to 53 percent by the 2017 school year.
Legislators could also establish a limit on carryover cash reserves and use the excess for a one-time reduction in state aid. Depending upon where the limit is set, hundreds of millions could be saved without reducing funds available to schools because they could draw down money left over from prior years; those without funds above the limit wouldn’t be impacted. School districts began the current year with a record $928 million in operating cash reserves.
Questions to Consider
Given these facts, here are a few questions to consider.
— A recent survey found 89 percent of voters believe spending on out-of-the-classroom costs (administration, building operations, transportation, etc.) should be provided more efficiently on a regionalized basis, with the savings put into classrooms. Is this a good idea?
— Do you believe school districts should be required to allocate a certain percentage of total funding to Instruction?
— Should legislators require utilization of bulk purchasing agreements?
— Should legislators restrict spending on certain items such as lobbying or hiring attorneys to sue for additional funding?


