
Structural segregation is alive and well in the Kansas public school system, a form of educational redlining manifested and protected by a rigid set of school district boundaries. In a previous blog, I presented local economic data and student performance to show how it exists within the City of Topeka where there are four public school districts. That data presents the grim reality that race and income- based segregation in education exists because the combination of economics and rigid district boundaries preclude families from attending higher performing public schools. Further evidence of the same structural segregation that exists in the Kansas City and Wichita areas is provided herein.
Kansas City
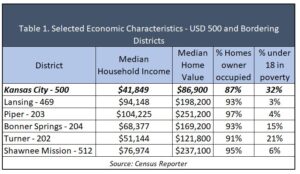
The Kansas City school district (USD 500) is bordered by five other public-school districts: Lansing (USD 469), Piper (USD 203), Bonner Springs (USD 204), Turner (USD 202), and Shawnee Mission (USD 512). Table 1 reveals how much lower the economic data is for USD 500 than the surrounding districts. Household income, home values, and the percentage of owner-occupied homes are all lower, while the poverty percentage of those under 18 is much higher.
Tables 2 and 3 show similar results regarding student achievement in Kansas City that also exist in Topeka:
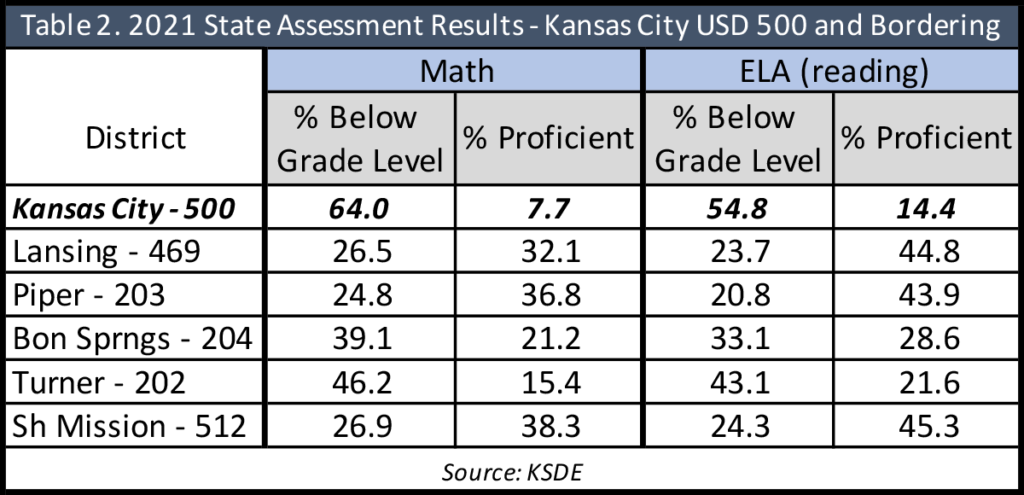

- State assessment scores for students in the Kansas City school district are much lower than those in bordering districts, both for all students and each of the subgroups.
- A staggering 64% of all students in KCK are below grade level in math, while 54.8% are below grade level in reading, much higher rates than all the bordering districts.
- USD 500 also has a higher rate of students below grade level than any bordering district for each subgroup in both math and ELA (reading).
- Conversely, KCK has a lower percentage of students in every category who score proficient in math and reading, with only a single exception. KCK’s Black students are slightly more proficient in reading than Turner’s Black students.
- Overall, the situation is much worse for African American students. Nearly three-quarters of Black students are below grade level in math, a rate much higher than bordering districts. Hispanics, who comprise over half the student population in USD 500, lag far behind their counterparts in bordering districts.
Table 4 is a summary of the racial mix of students in USD 500 and bordering districts.
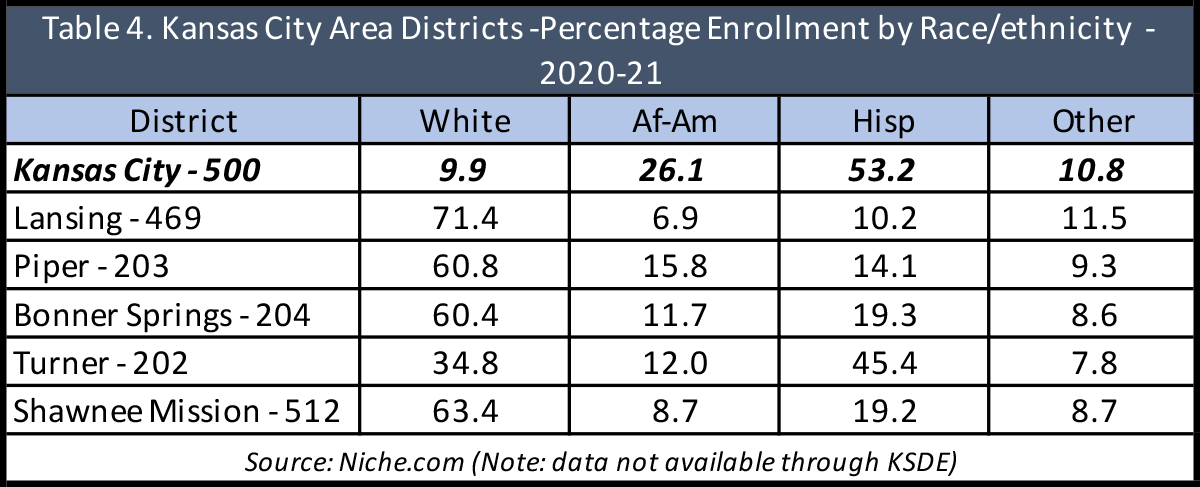
As Table 4 shows, Kansas City has a much different ethnic/racial make-up than the five bordering districts.
- While the bordering districts have a majority of White students, only one-tenth of USD 500 students are White.
- Over a quarter of KCK’s students are African American, a rate much larger than the others.
- KCK is the only district with a majority of the students Hispanic.
Wichita
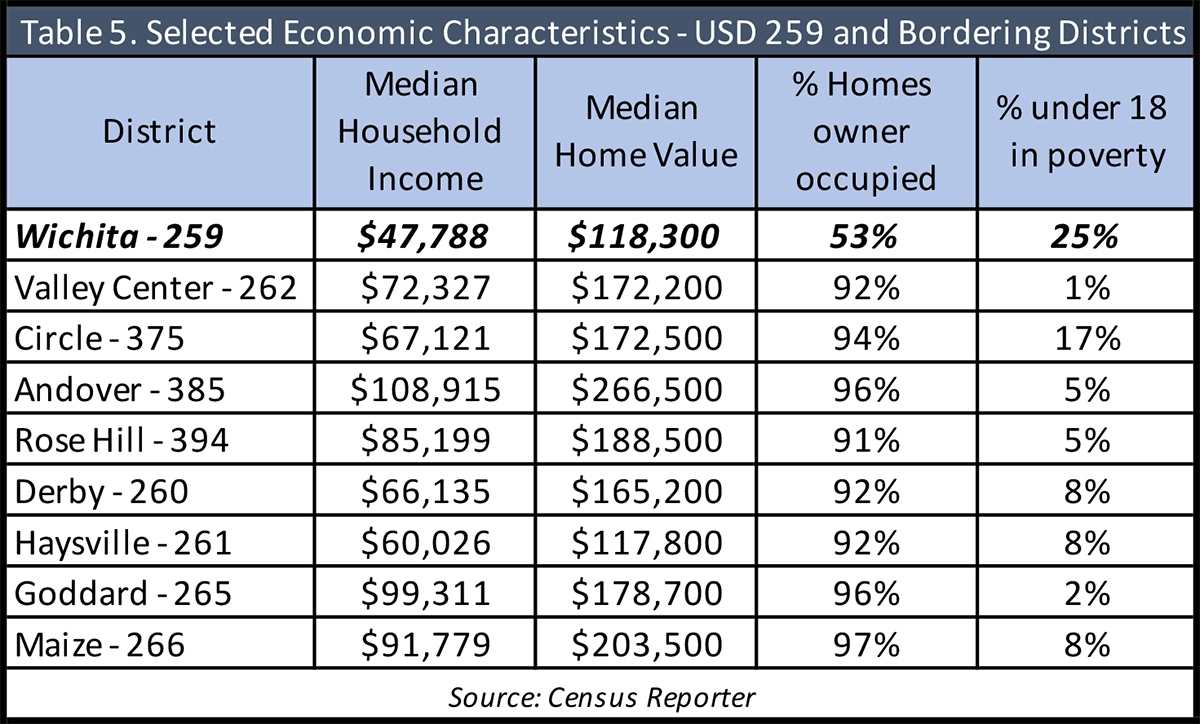
Wichita (USD 259) is by far the largest district in the state, with a headcount enrollment of 46,701 for the 2021-22 school year. Eight other districts border USD 259: Valley Center (USD 262), Circle (USD 375), Andover (USD 385), Rose Hill (USD 394), Derby (USD 260), Haysville (USD 261), Goddard (USD 265), and Maize (USD 266). Table 5 shows that Wichita Public Schools – although with better economic indicators than those in Kansas City in absolute numbers – is similar to Kansas City in that those indicators are much lower than the bordering districts. USD 259 has a lower median household income, lower median home value, a much lower rate of owner-occupied homes, and a poverty rate that towers above the other eight districts.
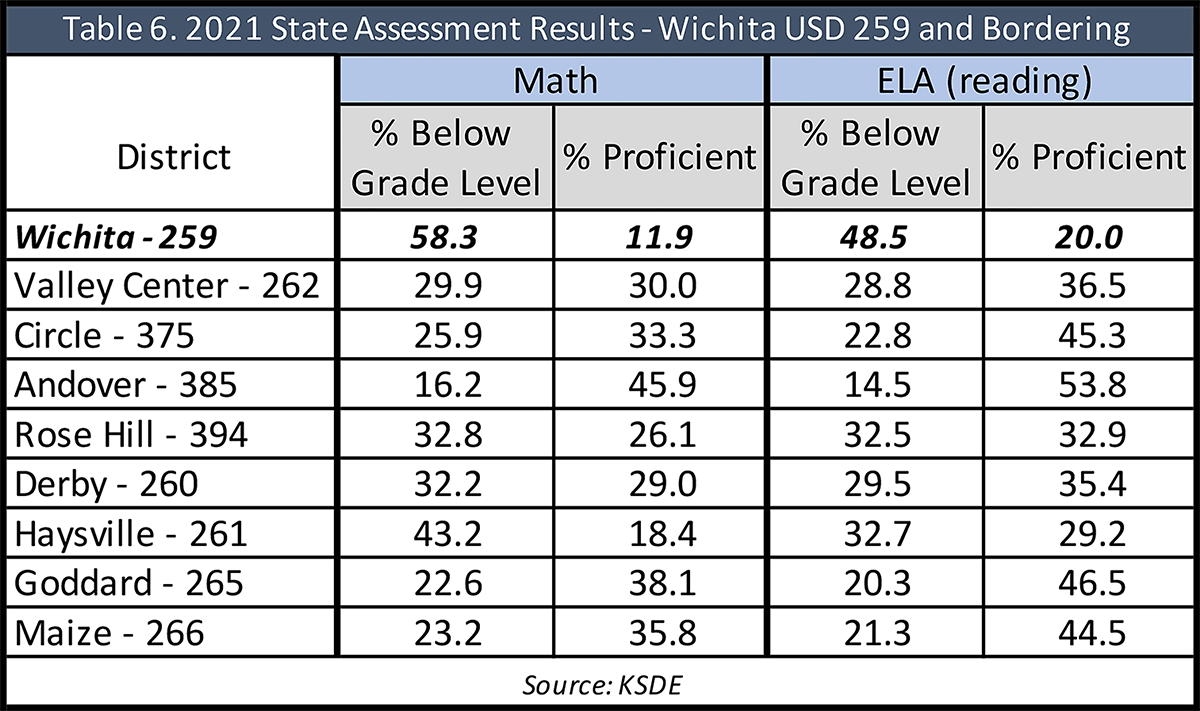
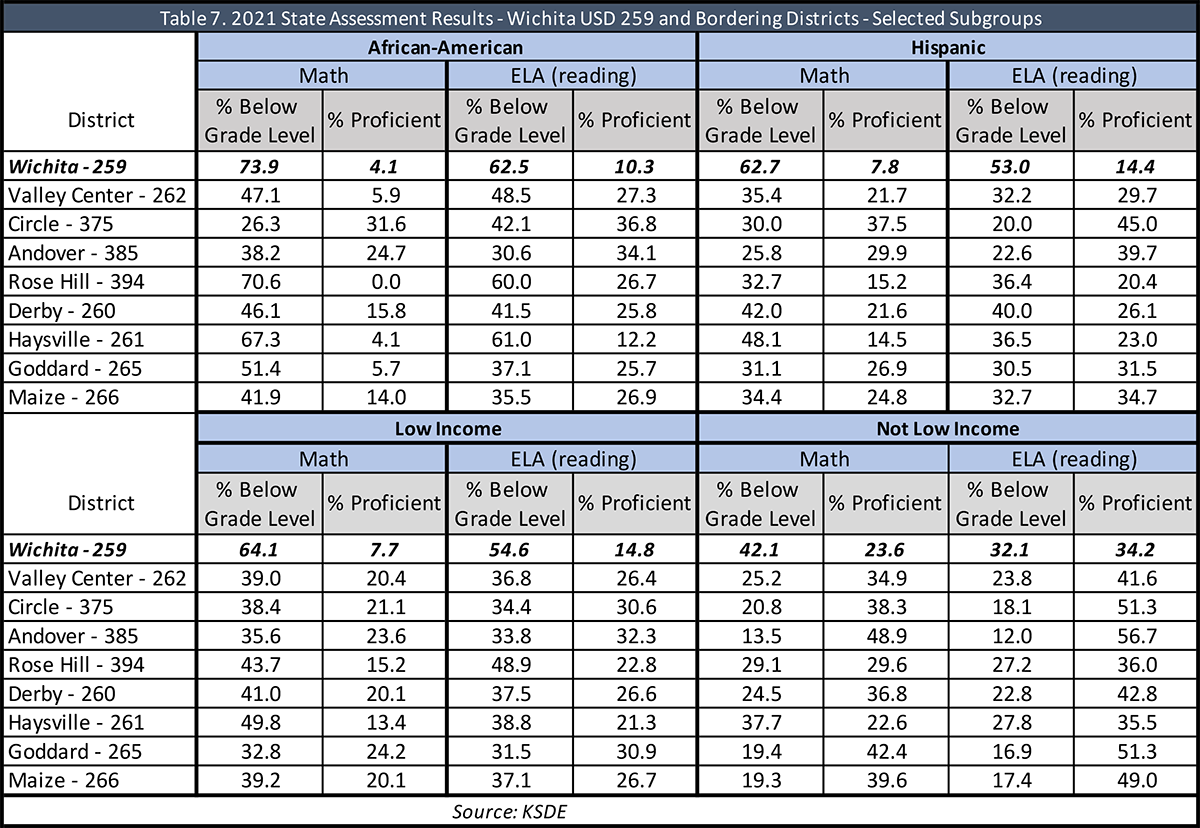
Tables 6 and 7 show that state assessment data in terms of comparing Wichita to districts that border is a virtual mirror image of the situation in Kansas City. To wit:
- Wichita students have a higher rate of those below grade level and a lower rate of those proficient in both math and reading for all students and subgroups compared to the other eight districts, save only a few instances.
- Nearly six in ten of all students are below grade level in math, while nearly half are below grade level in reading.
- Three-quarters of African American students perform below grade level in math. Less than 5% are proficient. In reading, almost two-thirds of African American students are below grade level. Hispanics perform slightly better, but still far behind most of their counterparts in bordering districts.
- The same holds true based on family income. Both low-income and not-low-income students lag behind those with similar incomes in the other eight districts.
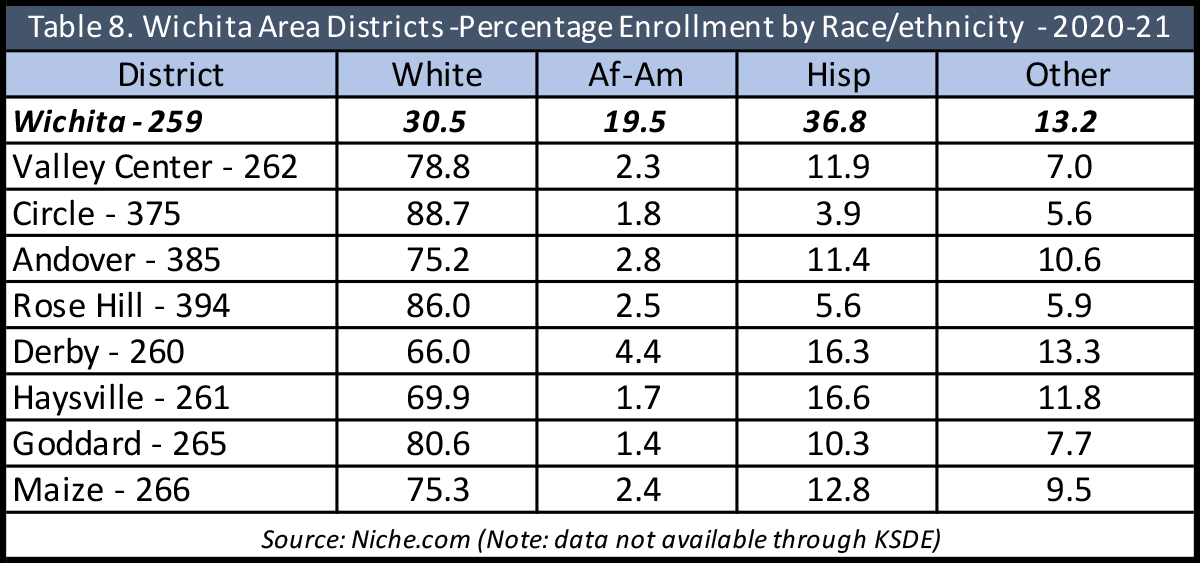
And as is the case in Kansas City, USD 259 has a much different racial/ethnic population than those districts in which it shares a border. The data in Table 8 shows USD 259 has a much lower White student population percentage and thusly a much higher percentage of Black and Hispanic population.
- USD 259’s White population is less than half the rate of any of the bordering districts.
- USD 259’s Black population percentage is nearly five times as large as Derby’s – the bordering district with the next highest rate of Black students.
- USD 259’s Hispanic percentage is more than twice that of any other bordering district.
In the analysis of the Topeka data, I concluded with this statement: “this data shows how entwined economics and school segregation is. Given the distribution of the real estate market and income levels in Topeka, most families living within the confines of the Topeka Public School district do not have the economic wherewithal to escape the low-performing schools they are forced to attend, due to the rigidity of district boundaries.” It is an unfortunate reality the same conclusion holds for both Kansas City (USD 500) and Wichita (USD 259).
I’ve said it before and it bears repeating: structural segregation is alive and well in the state of Kansas. If the only way out of a poor district is to leave, but one lacks the economic wherewithal to move, what else could the conclusion be?
The solution is easy conceptually, but difficult in practice: just give people the freedom to choose where they want to send their kids to school. The power of the district system, the entrenched bureaucracy of the education establishment, – and it’s the same for the ‘haves’ and ‘have-not’ districts – attempts to thwart any change to the status quo. During the current legislative session both chambers passed and sent a bill to Governor Kelly’s desk for signature; a law that would require a limited amount of open enrollment across the state. To no one’s surprise, the education establishment went on record opposing such a change. Why? The one reason virtually all opposition has in common is money. It’s always money, not student achievement, that is the priority of the schools.