Education Week has released its 20th annual edition of Quality Counts, a report card that provides an overall letter grade for each state’s education system. Kansas earned a C, with an overall score of 73.9 – slightly lower than the national average of 74.4 (also a C).
Quality Counts employs three indicators to establish an overall grade. Kansas earned a B- in the category called Chance for Success, defined as providing “a cradle-to-career perspective on the role that education plays in promoting positive outcomes throughout a person’s life.” For the School Finance indicator, Kansas earned a C. Unfortunately, Kansas’ worst indicator is in K-12 Achievement, a category in which the state earned a D.
K- 12 Achievement
The achievement category is an amalgamation of 18 outcome measures that include (1) NAEP scores, (2) graduation rates and (3) performance in high school advanced placement classes. The report uses detailed NAEP data, including proficiency rates, achievement gains, poverty gaps and excellence achievement. It is of note that Quality Counts does NOT consider a score in the “Basic” category an achievement, which is the same way KPI reports NAEP data. Here are a few lowlights regarding Kansas and the NAEP achievement gap data in the report:
- Only Oregon, Washington and the District of Columbia had a larger increase in the 4th grade achievement gap than the Kansas gap increase of 6.8%.
- While 31 states actually reduced the achievement gap in either 4th grade, 8th grade or both, Kansas had an increase in the achievement gap in both grades.
- Overall, the nation decreased the achievement gap by 0.4% for 4th graders and 0.6% for 8th graders.
- But the most alarming stat is the revelation that Kansas is the ONLY state in which NAEP math scores for both 4th and 8th graders are lower in 2015 than they were in 2003.
Ouch.
And for those who want to blame it on some bogus claim that it all has to do with spending, consider this: data used by Quality Counts ranks Kansas 15th in spending and 41st in achievement.
Achievement & Spending
It is often argued, especially by education establishment groups in Kansas, that there is a high correlation between spending on education and achievement. That supposition is not supported by the data used in Quality Counts.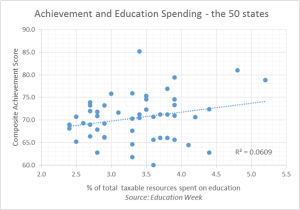 The scatter-plot below is a graphic display of combining the composite achievement score with the percentage of total taxable resources states spend on education. This scatter-plot of the 50 states shows a virtual flat trend line, indicating almost no correlation between the two. The R2 value, which is a numeric representation of how close each plotted point is to the trend line, of 0.06 falls far short of even being considered a “weak” correlation. Furthermore, the single outlier on the graph, Vermont (the only state that spends more than 5% of its total taxable resources on education), drives most of the incline of the trend line. If Vermont is removed, the R2 value is 0.02. Another interesting note is that the highest achieving state (Massachusetts) spends a lower percentage of their taxable resources than the lowest achieving state (Mississippi).
The results of this report strengthens two fundamental propositions of Kansas Policy Institute regarding education: (1) that Kansas is doing about average in a nation that under-performs and (2) there is no correlation between spending and achievement.