[vc_row][vc_column][vc_column_text]
The Fiscal Effects of the Kansas Tax Credit for Low Income Students Scholarship Program
By Martin Lueken
Legislators in the Sunflower State currently are debating a bill to create an education savings account (ESA) program for families of K-12 students.
Some policymakers have expressed concern about the potential fiscal impact of such a program. Fortunately, school choice is not new to Kansas, which already has the Tax Credit for Low Income Students Scholarship Program in place. As a result, we can look at the fiscal effects of the tax-credit scholarship program as a way to help inform policymakers about how choice program funding works.
A fiscal analysis of the existing program, described in more detail below, estimates that the program generated more than $1.7 million in cumulative fiscal benefits for state and local taxpayers combined, or $1,150 for each scholarship student in the program.
Launched in 2015, Kansas’s tax-credit scholarship program is the state’s first school choice program. Individual taxpayers and businesses can receive tax credits for charitable donations to nonprofit scholarship granting organizations (SGOs). In turn, SGOs provide scholarships to students to help them attend schools their parents deem the best fit for them.
Tax credits are worth 70 cents for each dollar donated, and the maximum amount of disbursements each year is $10 million. Tax credit disbursements have not reached this cap in any year so far, ranging from about $270,000 tax credits disbursed in the first year to $2.5 million in disbursements in FY 2020.
Eligible students must meet the following criteria:
- Students must come from a family whose household income is below 100 percent of the guidelines needed to qualify for the federal free lunch program ($34,060 for a family of four in FY 2021).
- Students must be assigned to one of Kansas’s 100 lowest-performing elementary schools as defined by the state’s board of education.
- Students must have been enrolled in a public school the previous year, unless the child is younger than 6.
Because of this program, more than 500 students received scholarships in FY 2020 to enroll in private schools of their choosing. Let’s now take a look at the fiscal effects this program has had so far on state and local taxpayers.
Fiscal effects of a tax-credit scholarship program
In FY 2020, the average amount of tax credit disbursements for charitable contributions for each scholarship student was $4,768, while the average per-pupil cost to enroll students in the public school system was $14,848. This program cost represents 32 percent of the public school system’s average cost.

This gap implies that the tax-credit scholarship program generates significant fiscal benefits for taxpayers and school districts when students do not enroll in the public school system because of the program. Students who would enroll in a nonpublic educational setting even without the program do not offset any of the program costs (these students are called “non-switchers”).
Generally speaking, the fiscal impact of a choice program is defined by the relationship between costs to operate the program and savings from students who would have enrolled in a public school if not for financial assistance from the program (also called student “switchers”). That is,
Net Fiscal Effect = (Savings from student switchers) –– (Cost of program)
Isolating the fiscal effects of a choice program to a single group of taxpayers, such as state taxpayers, requires granular data and applying the state’s school funding formula, a significant undertaking beyond the scope of this blog post. Instead, this article reports estimates for the short-run fiscal effects of the Tax Credit for Low Income Students Scholarship Program that accrue to state and local taxpayers combined.
Net fiscal impact on the state
The net fiscal impact of the tax-credit scholarship program on the state’s budget is:
NFI = (Avoided state costs from student switchers) –– (Total tax credit disbursements for charitable donations)
The amount of deferred costs to the state will depend on the state’s funding formula and a number of factors including the student’s district and characteristics that might generate additional funding for his or her district.
Net fiscal impact on public school districts
The net fiscal impact of the program on local taxpayers and public school districts is:
NFI = (Reduction in short-run variable costs from students leaving via the program) –– (Reduction in state revenue associated with students who leave public schools)
While it is true that districts experience reduced revenue when students leave, it is also true that educational costs go down to some degree because there are fewer students to educate. The extent to which costs are reduced when students leave depends on which costs are variable.
In the short run, some educational costs are variable while others are fixed. Variable costs change proportionally with enrollment (e.g., textbooks, software licenses, personnel costs). Fixed costs do not vary with enrollment in the short run (e.g., debt service, building maintenance). See here for details about educational costs.
To estimate variable costs, we modify a method used by economist Benjamin Scafidi. Scafidi observed what districts in Georgia did when they experienced enrollment declines. Specifically, he observed districts with declining enrollment and identified five categorical expenditures which they were able to reduce proportional to their respective enrollment declines. These costs were: Instruction, Instructional Staff Support Services, Pupil Support Services, Food Service Operations, and Enterprise Operations. The present analysis takes an even more cautious approach to Scafidi’s already cautious method by considering the first three categorical expenditures as variable and all other costs as fixed in the short run.
After combining the immediate two equations above, the combined fiscal effects of the tax-credit scholarship program on taxpayers and school districts will be:
NFI(combined) = (Reduction in variable costs after students leave via the program) –– (Total tax credit disbursements for charitable donations)
Because each student who would enroll in private school even without financial assistance from the scholarship program is an additional cost to taxpayers, a greater proportion of switchers implies greater savings from the state’s point of view and a greater reduction in state revenue that public schools receive, all else equal.
Results
Here are the topline results. From the tax-credit scholarship program’s inception through FY 2020:
- The program generated more than $1.7 million in cumulative fiscal benefits for state and local taxpayers combined.
- These cumulative savings amount to $1,150 for each scholarship student in the program.
- The program generated $1.16 in estimated fiscal savings, on average, for each dollar spent on the program. These savings result from students who exercised choice and would have been enrolled in a public school—at a much higher cost—if the program did not exist.
- On average, if at least 50 percent of scholarship students switched from public to private schools, the program will save taxpayer dollars overall.
The table below includes details for the analysis.
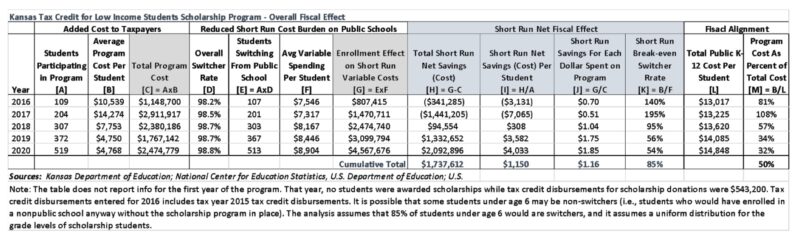
In FY 2020, 519 students received scholarships via the tax-credit scholarship program. The average cost per student of tax credit disbursements used to incentivize charitable giving for scholarships was about $4,800 per student, or a total of $2.5 million. This is just the cost, and opponents of choice programs usually stop here when discussing the potential fiscal impacts of these programs, with allegations that these programs drain resources and will deal irreparable harm to the public school system. But that’s not the whole story.
In FY 2020, total spending for the state’s public school system was $7.1 billion. Thus, the cost of tax-credit scholarship program in FY 2020 was just 0.03 percent of total spending on public schools.
So far, we have only talked about the program’s cost. Now let’s look at the savings.
As noted above, switchers represent an important factor in the fiscal analysis because they offset some or all of the program costs. The program requires students to come from public schools, children under age 6 being the exception. Thus, it is possible that some children under 6 who receive scholarships may enroll in a nonpublic school setting even without the program’s financial assistance. The analysis adjusts for this possibility.
Of the 519 scholarship students, 513 are likely switchers. The average reduction in short-run variable costs for these students is $8,900, and the total reduction in short-run variable educational costs is $4.6 million. Thus, the program generated an estimated $2.1 million in total net savings in FY 2020 for Kansas taxpayers, or about $4,000 per student. For each dollar spent on the program that year, the program generated $1.85 in fiscal benefits.
There is no evidence to support the claim that existing Kansas tax credit program “siphons” resources from public school or harm students who remain. Indeed, the fiscal impacts are clear: choice programs save money. Moreover, there is a robust body of evidence showing that students who remain in public schools after choice programs are enacted also benefit academically from the increased choice and competition (for instance, see here, here, here, and here). Contra to the critics, the evidence overwhelmingly demonstrates that educational choice policies are a fiscally responsible method to expand educational opportunities and foster academic excellence.
Marty Lueken is the Director of Fiscal Research and Education Center at EdChoice.[/vc_column_text][/vc_column][/vc_row]