It’s been too hard, for too long for parents to understand exactly how their child’s school is performing. Every state has a “Report Card” system that provides information on student performance, demographics, attendance rates and other related data regarding public schools. Most state systems, including Kansas, use ‘fuzzy’ labels like ‘approaching standard’ or ‘Level 1’ that make it difficult for parents to understand how a particular building is performing. Whatever happened to the A-F grading most Kansans understood from their own time in school?
At least 18 states, however, use labels that everyone understands from their own childhood – A, B, C, D and F.
A-F Grading represents an intuitive, transparent way to understand how schools are performing. KPI is releasing our version of the same today. All of the data included in our grade card is straight from KSDE and is searchable for each, individual school building in Kansas. KSDE has identified Levels 1-4 and we’re simply applying a letter grade to each of those and weighing them to determine an overall score for a building.
A full methodology outline, data, and definitions are available here.
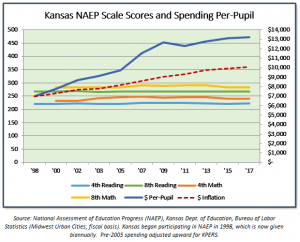
The education community and the Kansas courts contend achievement will improve if taxpayers just provide a l ot more money, even though spending more money has never caused outcomes to improve in Kansas or anywhere else.
And because there are large and persistent achievement gaps for low income students, we decided to produce separate grades for low income students and those who aren’t considered low income, based on the KSDE definition of equating low income with eligibility for free or reduced lunch. There is also wide variance in the percentage of low income students across individual buildings and districts, so producing a single grade averaging all students’ performance would produce misleading results.
A total of 1,272 public schools received grades for 2017; a few schools had to be excluded because of data limitations related to privacy issues. Only one school, Prairie Creek Elementary in USD 230 Spring Hill, earned an A, while 26 schools received a failing grade. The majority of schools (56 percent) received a “C” while 15 percent earned a “B” and 27 percent received a “D.” High schools have significantly lower grades, however, with 51 percent getting a “D” and 40 percent earning a “C.”
This project raises a wonderful opportunity to explore the “whys” of each of the grades. Why is one school doing very well with low income students whereas another school is struggling? Why, and how, are scores changing as students advance through their academic career? For lack of a better descriptor, we hope this allows for a series of “case studies” to evaluate how different schools are tackling similar challenges.
Lastly, we’re are also initiating a school improvement award in conjunction with Dr. Glenn Swogger and his late wife Claire. Click over to the main A-F Grading site to see the schools that improved their performance between 2016 and 2017.


