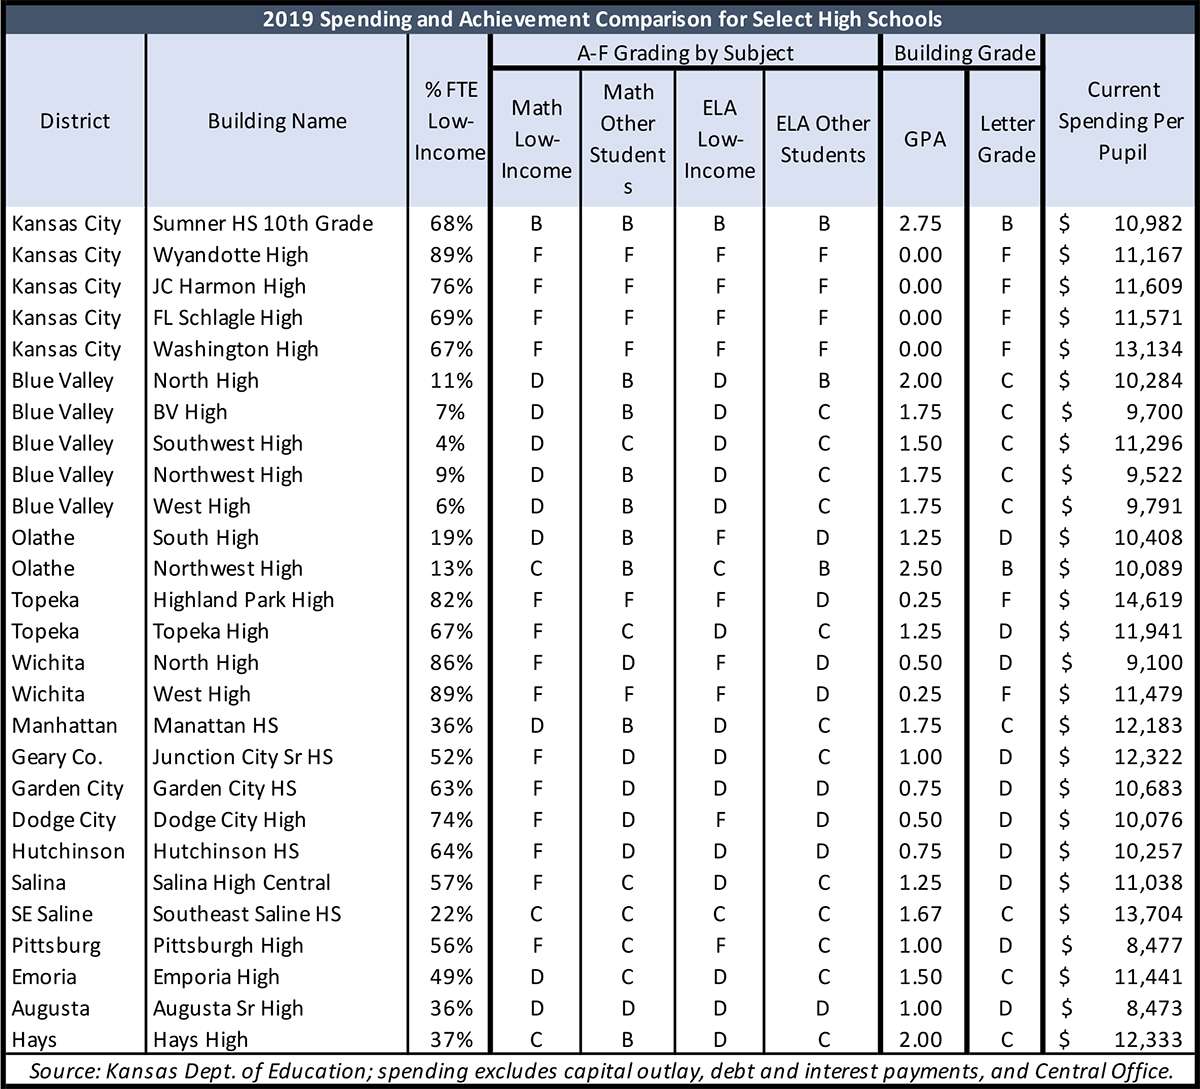
Of the five high schools in USD 500 Kansas City, the one that spends the least amount per-pupil has the highest scores on the state assessment test. Each school has high levels of economically challenged students, but one school earns a ‘B’ for its state assessment results and the other four get an ‘F.’
Spending per pupil at the state and district level has consistently debunked claims that spending more money will improve student achievement. Now building-level spending is finally available, showing dozens (if not hundreds) more examples that dispel the myth.
Pe-pupil spending in the table below comes from the Kansas Department of Education (KSDE), using methodology prescribed in the federal Every Student Succeeds Act. It’s called ‘current spending’ and excludes school debt spending, capital outlay payments, and central office administrative costs.
The letter grades assigned to each school come from KPI’s ‘A-F Grading System’ that translates state assessment scores into letter grades using the KSDE definitions and cut scores.[i]
Each of the five high schools in USD 500 Kansas City has high levels of students considered low-income based on eligibility for free or reduced lunch. Four of them earned an ‘F’ but 10th-grade students in the Sumner Academy for Arts & Science earned a ‘B” while having the lowest per-pupil spending among the five schools. Sumner spending was $10,982 in 2019 while the others ranged from $11,167 to $13,134.
 Sumner Academy is a magnet school that requires students to have good grades, a good behavior record, and a good attendance record for acceptance and to remain in the school. Accountability seems to make a difference.
The education lobby may discount the Sumner example because it’s a magnet school, but there are many others that can’t be excused away.
Blue Valley High School and Southwest High School in USD 229 both earned a ‘C’ but Southwest spent $11,296 per pupil while BV High only spent $9,700. BV High also had a slightly better Grade Point Average (1.75 vs 1.50).
Olathe Northwest High School spent about $300 per pupil less than Olathe South; they have similar levels of low-income kids, but Northwest earned a ‘B’ and South gets a ‘D.’
Wichita North High and Topeka Highland Park High have similar low-income levels; both earned an ‘F’ but Topeka spent $5,519 more per pupil than Wichita.
Pittsburg High and Salina High Central have similar low-income levels. Both schools earned a ‘D’ but Salina spent $2,561 more per-pupil than Pittsburg.
Central Office spending variances
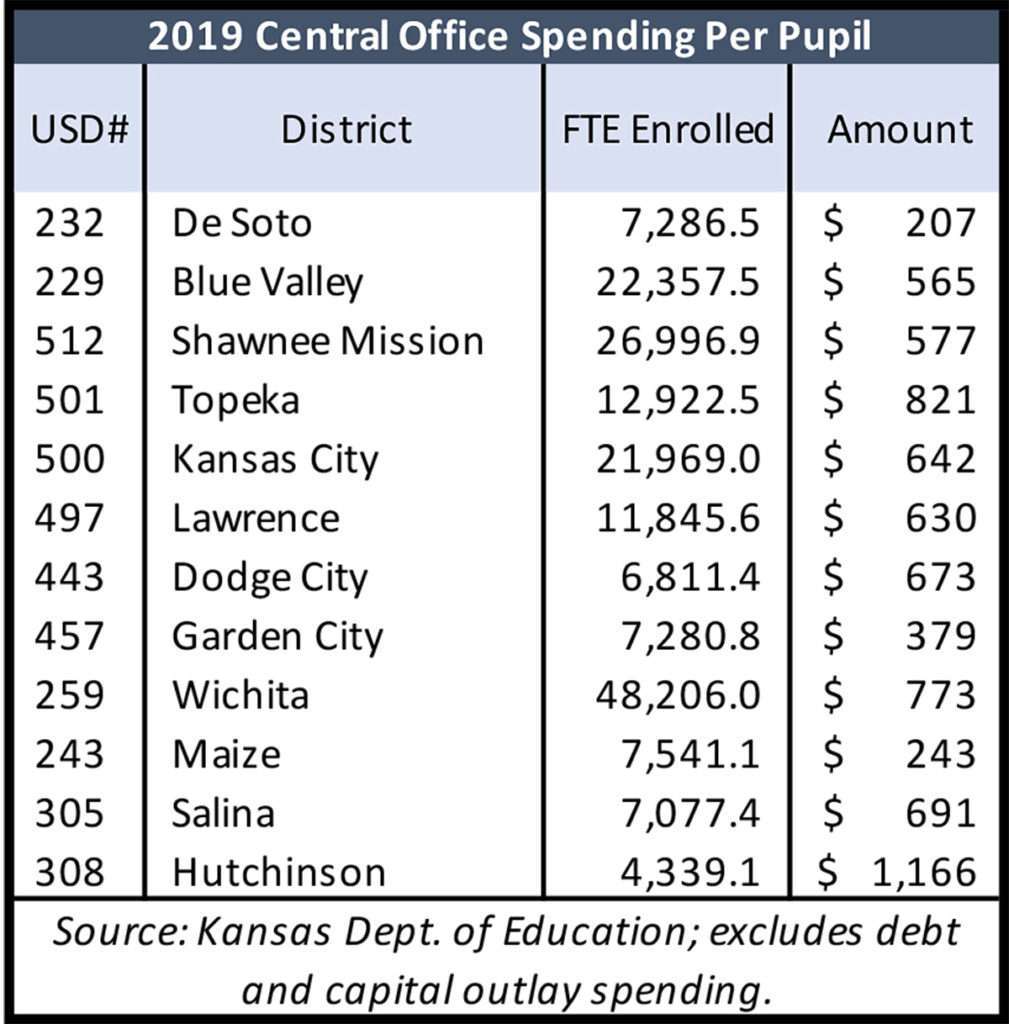
There are also large per-pupil spending variances on Central Office functions across districts.[ii]
 USD 232 De Soto in Johnson County has a long track record of holding down administrative costs. They spent just $207 per pupil last year while other Johnson County districts spent more than twice as much. For example, Blue Valley spent $565 per pupil, and Shawnee Mission spent $577. Had Blue Valley operated its Central Office as efficiently as De Soto, they would have been able to spend $8 million more on instruction; Shawnee Mission could have spent $10 million more on instruction.
Spending just $243 per pupil, USD 243 Maize in Sedgwick County is another district that provides Central Office services at much lower costs. If the Wichita district was operated as efficiently, it could have spent $27.3 million more on instruction.
The four plaintiff districts that sued taxpayers claiming to be underfunded each have high Central Office costs. USD 308 Hutchinson spent $1,166 per pupil, Wichita spent $773, Dodge City was $673 per pupil, and Kansas City spent $642.
Building-level spending for all public schools
Per-pupil spending for each public school and district central office is available at KansasOpenGov.org in the Spending by Building report.
[i] The 2019 A-F grades for all buildings based on the 2019 state assessment test will be published soon.
[ii] The KSDE Accounting Manual defines Central Services as activities that support other administrative and instructional functions including fiscal services, human resources, planning, and administrative information technology.


