Much of the focus on state assessment scores is how low-income students are performing and achievement gaps – and deservedly so. Nevertheless, the Kansas Supreme Court’s current Gannon rulings all but demand a continued evaluation of overall achievement. The justices have staked out a claim that there is a causal relationship between money and outcomes. And one that is not only causal, but one whose impact is immediate.
As KPI reported in this article, despite an increase in spending in the 2017-18 school year, performance by low-income students actually decreased. And in this KPI article, the Court’s assertion of a causal relationship between spending and outcomes in Kansas is debunked when analyzing differences among the 286 school districts.
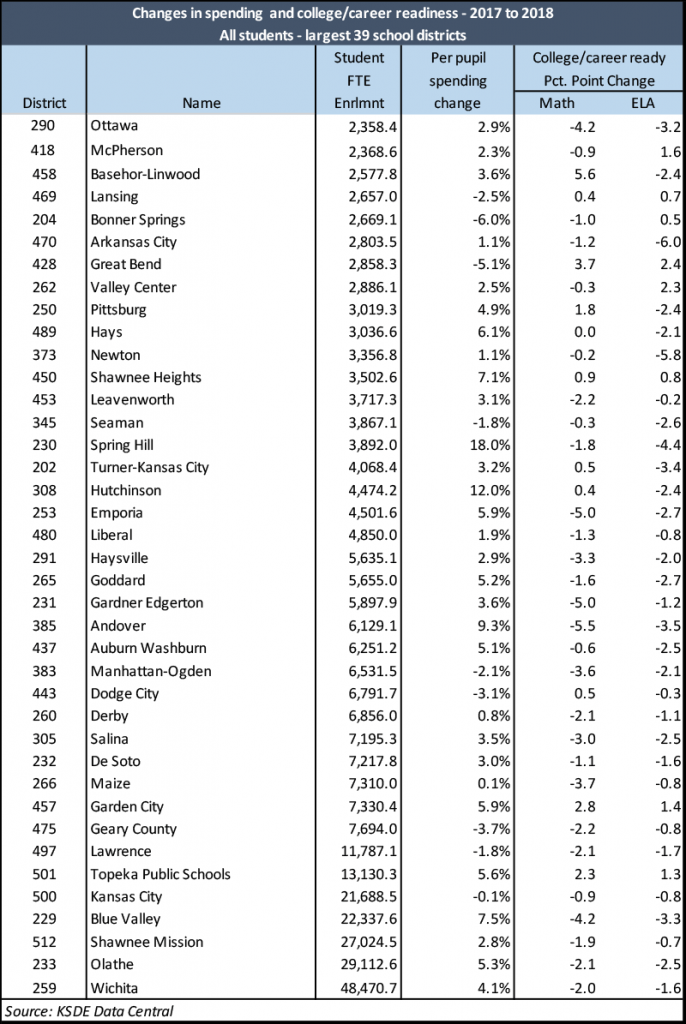
In the table below, Per pupil spending change is the percent change in spending. The College/career ready is the percentage point decline; Ottawa had 28.73 % of students scoring Level 3 or 4 in 2017 on English Language Arts (ELA) while in 2018 25.56% of students scored Level 3 or 4. Thus, Ottawa has a 3.17, rounded to 3.2, percentage point decrease across the two academic years on the ELA state assessment, as shown in the table.
 This presentation is an extension of that methodology and asks this fundamental question: How did student outcomes change from 2016-17 to 2017-18 within districts given changes in per-pupil spending? Not all districts were selected for this research because in small districts per-pupil expenditures can vary widely from year-to-year, since a small change in the number of students has a disproportionate share of impact on per-pupil spending. For example, Brewster (USD 314), with a student FTE of 131 had a per-pupil increase of 149.6% last year. At the other end of the spectrum, Cunningham (USD 322), with 158.5 FTEs decreased per-pupil spending by 39.6%.
The same is true when it comes to assessment results. The scores of a few students in small districts can disproportionately impact a district’s overall performance.
Three-quarters of all Kansas students reside in the state’s 39 largest districts. Since changes in student population in large districts have a much smaller impact on per-pupil spending, it is those districts that are included in this analysis.
The table shows the changes in spending and state assessment results for all students in all grades for each of those 39 districts. Thirty districts increased per-pupil spending and nine districts had lower per-pupil costs in 2017-18 than 2016-17.
Regarding changes in the percentage of students considered on track for college/career readiness, 28 districts saw those percentages go down in math and 31 were lower in English language arts (ELA). Twenty-five districts had lower percentages in both subjects, only five increased in both. Basehor-Linwood showed the biggest gain in math, increasing from 33.2% to 38.8% – a 5.6 percentage point (pp) jump. Great Bend’s students increased 2.4 pp, from 27.3% to 29.7% in ELA, the largest gain among those districts. Andover had the biggest drop in math, 5.5 pp from 58.8% to 53.3%, while Arkansas City’s 6.0 pp decrease in ELA, 27.7% to 21.7%, was the largest tumble. Spring Hill is worth noting. Despite an increase in per-pupil spending of 18%, both math and ELA college/career readiness declined.
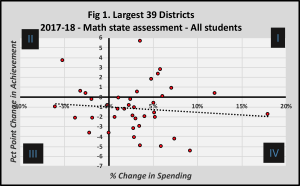
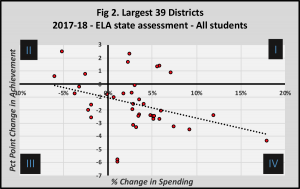
The two scatterplots below provide a much clearer picture of the relationship between spending and achievement changes for those districts. Figure 1 displays the results for math and Figure 2 are the results for ELA. The scatterplot is divided into four quadrants. Here’s what they mean:
-> Quadrant I: higher spending/higher scores.
-> Quadrant II: lower spending/higher scores.
-> Quadrant III: lower spending/lower scores.
-> Quadrant IV: higher spending /lower scores.
Particular attention should be focused on quadrants I and IV. The points in those quadrants signify the 30 districts that increased spending. As you can see, many more of those districts had a lower percentage of students on track for college/career readiness in both ELA and math. For ELA, 25 of the 39 districts spent more per pupil, but had lower outcomes. For math, 23 districts spent more and experienced lower outcomes.


These facts defy what the Court wants to believe. If the Court’s position were correct, at minimum a majority of the points would fall into quadrant I – more spending and higher outcomes. That didn’t happen. The trendline even shows a negative relationship between spending and outcomes, but by no means does that suggest that more money leads to lower test scores. That assertion, based on a single instance like this, would be as disingenuous as concluding more money leads to higher test scores without considering other factors.
This analysis is yet another example of just how wrong the Court is when it comes to spending and outcomes. Whether looking at low-income students, all students, and/or achievement gaps, the data is clear as a Kansas blue sky: an increase in education spending does not lead to better achievement/outcomes for Kansas students. This is not a revelation, but a reminder as the Legislature considers putting even more taxpayer dollars into the kitty for education in order to satisfy justices who cling to the idea that more money will improve student outcomes despite mountains of evidence to the contrary.
One more time: more money is not the answer to improving student achievement.


