As the saying goes, to control the narrative is to control the world. When it comes to the sphere of public education, a dominant narrative is that the volume of funding/spending by public education is a determinant of quality. This is exceptionally true in the state of Kansas. The Kansas Supreme Court has made it clear in its plethora of decisions in the Montoy and Gannon cases that a principal goal of education is to spend more money. It’s time to change the narrative.
Education Week’s annual Quality Counts (QC) report is a stunning example of promoting this narrative and its 2020 Quality Counts school finance piece is no exception. The study grades and ranks the “quality” of education in each of the states along with the District of Columbia.
QC employs eight factors to determine a state’s overall finance score and grade – four in what they call “equity” and four in “spending.” Even though eight different measures are employed, seven of those are a function of per-pupil spending, the factor which becomes the main driver of the states’ finance score/grade.
In using this approach to define “quality,” the prestige that Education Week enjoys continues the (false) narrative that the amount of money spent and how it is divvied up within a state is a major element of the quality of education in each state.
Why is that?
Why have so many at so many levels accepted that as a given? Where else in society – outside the government province – is merely spending money a metric of success? It’s not true in the movies – how many huge budget movies have bombed both critically and at the box office? It’s not true in sports. The quality of a professional golfer, for example, is not determined by the retail price of shoes worn or how much he or she pays a caddie or coach. The Oakland A’s, of Moneyball fame, have made the playoffs five times in the past decade despite being at or near the bottom of spending. And according to the latest salary numbers, NFL teams spend more money on 34 quarterbacks than the Chiefs spend on Patrick Mahomes. Enough said.
In entertainment and other business ventures, quality is ultimately determined by the end product. In sports, it’s measured in wins/losses or performance. In other words, it’s the outcome that determines quality not in the inputs.
But that’s not true in the dominion of public education. Later this year, QC will release the final piece of the report, student achievement. If the 2020 report is like previous years, most of a state’s score will be a function of the latest NAEP scores. That is unquestionably a reasonable and appropriate measure of student achievement. Unfortunately, in the final analysis, QC will give equal weighting to both achievement and spending (along with the third category called “Chance for Success” – which is a discussion for another day) to determine a final overall “quality” grade and ranking among the states and D.C.
Would any reasonable person – outside the education establishment – consider that how much schools spend on education is as important as the achievement of the students? That’s only plausible IF student achievement is a function of spending. In other words, it would make sense if higher spending leads to higher achievement, along with converse being true.
Using a modification of QC’s methodology that postulate can be tested.
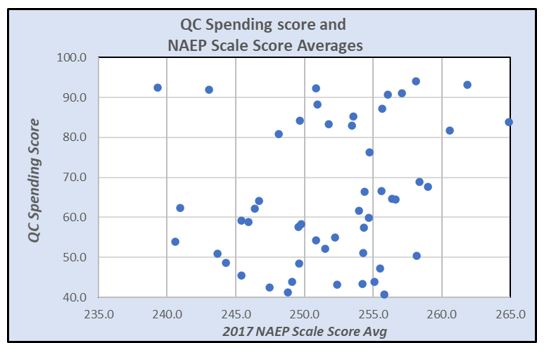
 QC gave each state a spending score based on a 100-point scale. Per-pupil expenditures, the dominant factor in the score, was adjusted for regional cost differences. QC sourced 2017 per-pupil expenditures, the latest available. The accompanying table provides each state’s spending score along with the 2017 NAEP scores. The NAEP scores are an average of the four scale scores from 4th and 8th grade math and reading. The graphic that follows is a scatterplot of each state in terms of spending and outcomes. The distribution of the scatterplot tells the story of the absence of influence the input of spending has on the outcome of student achievement. If there was a correlation (which is different from causation) the distribution (dots) would cluster around a line that bisects the graph from the southwest to the northeast corners. Instead, the distribution looks like buckshot.
 Consider these:
-> The District of Columbia had the third highest spending grade but is last in student performance.
-> Utah earned the lowest spending score but had better NAEP scores than all but 11 states.
-> Massachusetts had the highest NAEP scores but had a spending score lower than 11 states.
This is another example, as KPI has reported on several occasions, that there is no relationship between spending and achievement. Therefore, spending should not be considered a metric of quality.
The purpose here is not to be a broken record, just repeating the same old refrain. The intention is to change the narrative and focus on what matters. And now is the time. The fallout of the COVID-related recession is going to put a major dent in state revenues and the ability to fund public education at court-prescribed levels. If the pervasive narrative that spending is a measure of quality continues unchallenged, it will have a devastating effect on Kansas taxpayers and other government services without the benefit of improving student outcomes.