Question: How can Kansas have the 9th best achievement in the nation when achievement rankings on NAEP and ACT range from the mid-teens to the low 30s?
Answer: When KASB heavily weights things that don’t measure academic learning.
The Kansas Association of School Boards (KASB) has released its fourth annual report called “Comparing Kansas.” KASB has structured its analysis with carefully selected and manipulated data that ranks Kansas ninth in the nation in student achievement, unchanged from last year. The real purpose of “Comparing Kansas” is twofold:
-> to show that student achievement is high thanks to the public education system, and
-> that ranking would improve if education funding would increase.
What do the eight states ahead of Kansas all have in common? You guessed it, they all spend more money per pupil than Kansas. The reader is reminded no less than nine times in the latest Tallman Report that Kansas education is somehow able to perform well despite being a virtual financial pauper compared to other states. Once again, KASB incorrectly implies a causal relationship between spending and student outcomes. KPI, along with other researchers, has shown time and again that no correlation, let alone a causal relationship, exists between money and achievement.
The report, as described in detail in the Tallman Report, is plagued with a methodology that cherry-picks and manipulates data. “Comparing Kansas” relies heavily on indicators that don’t measure achievement like graduation rates and postsecondary choices. Graduation rates are rooted in grade inflation that leads to social promotion – the practice of passing all students to the next grade to keep them together due to age. And whether or not someone chooses to enroll in a postsecondary institution is not a measure of academic achievement. “Comparing Kansas” relies less on assessments that do measure achievement in order to give Kansas another lofty ranking. As KPI has previously explained, no reliable ranking of the states is possible.
That notwithstanding, how could Kansas have such a high ranking when:
-> The graduation rate for all students is 24th in the nation?
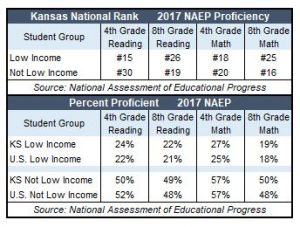
-> Results from the National Assessment of Education Progress (NAEP) has Kansas subgroups ranked between 15th and 30th?
-> Kansas students rank 23rd in the nation in composite ACT scores?
We should never lose sight of the real purpose of any public education system – to prepare students for life after schooling. Rankings aside, how can an education system be considered successful when:
-> only about a third of all Kansas eighth-graders are proficient in math and reading, that rate is merely 1 in 5 for low-income students?
-> only about 30% of Kansas graduates who take the ACT are considered college-ready in all four academic categories?
-> 24% of Kansas 10th graders are considered college/career in math and only 29% in reading? For low-income students, those percentages drop to 11 and 16 respectively.
A deeper dive into the indicators provides insight into the methodological shortcomings employed by KASB. Three overarching indicators have been identified and subjectively given equal weighting.
-> Graduation
-> Postsecondary
-> Assessments
Graduation
KASB relies disproportionately on graduation data to give Kansas such a lofty ranking. Graduation rates count for a full third of the overall comparative score. There are issues inherent with using graduation as an indicator of student or institutional success and trying to compare that data among the states. Simply put, graduation from high school is no longer an accomplishment, it’s a choice. If a student chooses to stay in school for four years, that student will graduate. Therefore by default, it’s no accomplishment for the school either. Additionally, there are obvious problems comparing graduation rates from one state to another. Each state sets its own standards for graduation making comparisons irrelevant.
Even if you disagree and feel graduation rates are an indicator of success, Kansas ranks 24th in the graduation rate of all students, according to the latest available National Center for Education Statistics, with a rate of 86.5%. That’s hardly a top-ten ranking. But KASB buttresses Kansas’s standing in graduation by including graduation rates for three subgroups: economically disadvantaged students, students with limited English proficiency and students with disabilities. Those students do well when compared to the same subgroups in other states when it comes to graduation. KASB takes statistical advantage by not only including them in the analysis but giving those three subcategories the same weighting as the “All students” category. If that’s not problem enough, the same student could be included in all the categories, thus being counted as many as four times.
Postsecondary
This indicator is subdivided into three equally weighted measurements and also accounts for one-third of the total ranking:
->High school completion or higher
-> Some college or higher
-> Four-year degree or higher
There are several issues with using this data as a reflection of the public education system, both with the numbers and the underlying assumption. The first is the fact that KASB is double-counting high school graduation. Many of the students who are counted in the Graduation indicator are included in the Postsecondary – “High school completion or higher” category. Secondly, the three subcategories are not mutually exclusive. For example, someone between 18 and 24 who has a bachelor’s degree is counted in all three subcategories in the survey. According to the U.S. Census Bureau data utilized by KASB, 88.1% of 18 to 24 year-olds have high school or higher, 58.9% have some college or higher, and 10.6% have a four-year degree or higher.
Finally, and perhaps most significant, KASB is assigning the public school system responsibility for what graduates do and how successful they are once they leave high school. Unlike high school, post-secondary education is a choice, and given the current astronomical cost of a college education, going to college is often an economic choice. And given the different economic realities among the states, it is a foolish endeavor to try to compare and rank them.
Assessments
Once again, KASB begrudgingly incorporated assessments in the rankings but weighted them to provide Kansas an artificially lofty perch. They included the National Assessment of Education Progress (NAEP), ACT, and SAT scores in the Assessments category. The fact that they weighted those three assessments equally is another gauge of the flawed KASB methodology.
NAEP
Of the fifteen total data sources that comprise “Comparing Kansas,” NAEP is the only one in which can honestly  provide state-to-state comparisons – assuming they are presented honestly, which in this case they are not. Overall, NAEP counts for only 11.11% of the total score and was subdivided into six categories of 1.85% each. In addition to the subjectivity of such a weighting scheme, KASB again violated a research fundamental by counting results of the same student multiple times. The table showing how Kansas ranks nationally using the most recent NAEP results gives no indication that Kansas is anywhere near the top ten.
ACT and SAT
Two assessments that cannot provide state-to-state comparisons are the college entrance exams, ACT and SAT. In Kansas, the ACT is much more frequently taken than the SAT. What makes ACT results incomparable among the states is that in some states it is a requirement for all students to take the ACT, even those with no post-secondary aspirations. In 2018, 100% of students in 19 states took the test, compared to 71% of Kansas students. Not surprisingly, the states that require all students take the test have among the lowest composite averages. When compared to those states in which approximately the same percentage of students take the test, Kansas ranks about in the middle.
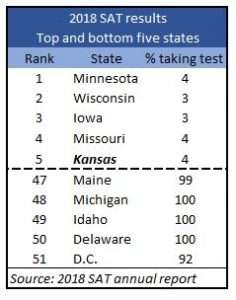
It is the use of the SAT results that are the most egregious. The KASB methodology gives Kansas an adjusted rank of  eighth in the country for the SATs. And it is given the same weight as the ACT and NAEP results. This, despite the reality that only 4% of Kansas grads take the SAT. And it’s no anomaly that a low percentage of grads taking the test leads to a higher ranking among the states. The adjacent table provides clear evidence that the percentage of students taking the test and state rank are highly correlated.
And that makes perfect sense. Students taking the SAT are not from some random sample. These are highly motivated students, most of whom aspire to go to an out-of-state private college. As evidence, here are the ten most desired universities as self-reported by those taking the test:
- University of Kansas
- Kansas State University
- Cornell
- Stanford
- Wichita State
- Harvard
- University of Southern California
- Penn
- Northwestern
- Princeton
Although the Tallman Report recognizes the difficulty in comparing ACT and SAT results due to the percentage of students taking the test, they justify their ranking method by applying an undefined technique that “attempts to correct for this by comparing each state’s actual ranking with what would be expected based on the percent of graduates tested.” Hmmmm….
Another curiosity is the narrative treatment provided in the Tallman Report regarding assessments. KASB attempts to discount the NAEP results, saying
NAEP is only given to a small sample of students (“several thousand” according to KSDE); only at fourth and eighth grade in reading and math, and only given every two years. While the same test is given in each state, it does not reflect differences in state curriculum standards, and measures students on a single test on a single day. Many educators, parents and policy-makers have criticized that approach as too narrow.
This disclaimer demands a rebuttal. First, KASB makes it sound as if there is no science in choosing the students who take the NAEP. (A full description of the NAEP sampling procedure is available here). If it were true that NAEP did not test a representative sample of students in a state, scores would likely vary significantly from test to test. That does not happen. Secondly, KASB criticizes NAEP for being a single-test, single-day approach, but they make no such criticism of ACT and SAT, which are also single-test, single-day assessments. Thirdly, the curriculum standards excuse fails to recognize that if such differences exist regarding NAEP that would also hold true for the two college entrance tests. Finally, criticism by “many educators, parents, and policy-makers” isn’t exactly a peer review.
“Comparing Kansas” is a perpetuation of KASB’s attempt to mask the truth about the Kansas K-12 education system by incorporating only carefully selected data. The truth is the Kansas education system ranks somewhere in the middle in a nation that has a public education system that continues to underperform. Overall achievement is low and achievement gaps between the haves and have-nots are at persistent, unacceptable levels. As KPI has stated previously, this report should be considered nothing more than an attempt to avoid the real education issues in the state – and those issues that cannot be solved simply by throwing more taxpayer dollars at it.


