The executive directors of the Kansas Center for Economic Growth (Annie McKay) and the Kansas Economic Progress Council (Bernie Koch) are going around the state with a presentation entitled “The Impacts of Kansas’ Changing Tax Policy.” School districts in Dodge City, Garden City and Clearwater hosted the events. It was decidedly partisan and from the perspective of people opposed to income tax reform and the efficiently-operated system of government that is necessitated by placing a smaller tax burden on citizens.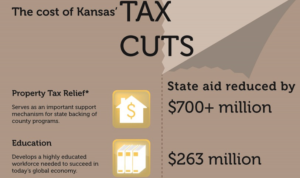
As discussed in another blog post, recipients of taxpayer funds should not promote, arrange or participate in any type of one-sided policy discussions, and government facilities should also not be used for such purpose. This post will address the most egregiously misleading claims made in the presentation.
Annie McKay (KCEG) showed this slide attributing a $700+ million reduction in state aid for property tax relief and city/county revenue sharing to tax cuts, which is a very deliberate fabrication. The source on the slide references a paper published by KCEG, which says, “Cities and counties across the state have lost more than $700 million since 2008 from lawmakers defunding of two important sources of local support….”[1] Since 2008? Tax cuts didn’t go into effect until 2013.
They list the source for that claim as “Analysis of data from the Kansas Association of Counties Research Report, multiple years.” A search of the archived reports at KAC (no specific report was identified and Ms. McKay refuses to make her data available) found a table showing the actual and projected amounts by fiscal year.[2]
As shown by this screen grab from the KAC report, the amounts projected for 2009 through 2013 total $714 million but the actual amount received was zero! In fact, no funding has been provided since 2004 – but that doesn’t stop KCEG from falsely blaming the 2013 tax cuts for more than $700 million in reduced state aid to local government. The projection calculated by KAC is merely an estimate of would have been received in funding had continued; former state budget director Steve Anderson reviewed state budget documents and confirmed that no funding has been provided for Local Ad Valorem Tax Relief (LAVTR) or City/County Revenue Sharing (CCRS) since 2004.

KCEG’s claim that tax cuts are to blame for a $263 million reduction in state aid for education is also not true;, their (unsubstantiated) calculation pre-dates the implementation of tax reform: “Total state aid to school districts has been reduced by over $263 million since fiscal year 2008.”[3] The truth, according to the Kans as Department of Education, is that state aid has increased by $249 million since income tax reduction was implemented in 2013. (The amount shown as state aid does not fully represent the state’s provision for finance of public education. Total school funding for 2014-15 is estimated by KSDE at $6.15 billion, the vast majority of which is raised on state authority. Federal funding is only estimated to be $510 million.)
KCEG also claimed that tax reform caused those earning less than $36,000 to pay more taxes while providing a large savings to those with high incomes; their claim is based on information from the Institute on Taxation and Economic Policy (ITEP). As is often the case, no data is provided to substantiate the claim, and ITEP wouldn’t release their calculations. Refusing to provide substantiating data is a common practice of KCEG, ITEP and other organizations with a big-government perspective; the Center on Budget and Policy Priorities has also repeatedly ignored our requests for data.
ITEP did, however, share some eye-opening information about their methodology. They acknowledge that legislative fiscal analysts in most states use income definitions based on Adjusted Gross Income (AGI) but ITEP adds their own estimation of non-taxable and partially-taxable income from sources such as Social Security benefits, Worker’s Compensation benefits, unemployment compensation, VA benefits, child support, financial assistance, public assistance, and SSI in their measure of Total Income.[4] They also make this astonishing claim: “It’s widely understood that taxpayers at all income levels tend to under-report certain income categories, especially capital gains, pass-through business income, rental income and farm income. For this reason, ITEP’s model makes estimates of the amount of unreported income of each type. This unreported income is included in our “total income” estimates for each state.”
Aside from accusing farmers and other entrepreneurs of being tax cheats, the folks at ITEP believe they can reasonably estimate the degree of ‘cheating’ by income class in Kansas! By doing so, ITEP is able to assign a much higher value of tax savings for those in upper income brackets. Imagine the media outrage if a free market organization was caught ‘cooking the books’ and refusing to disclose the ‘proprietary’ data upon which their allegations are based.
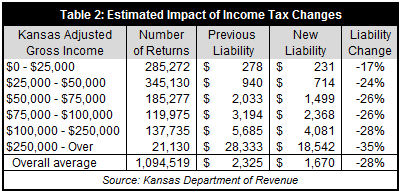 It’s true that those with higher incomes received a larger percentage reduction in their tax liability, but that is merely a reflection of Kansas having a graduated income tax. Prior to 2013 there were three income brackets; the first $30,000 on a joint return was taxed at 3.5%, the next $30,000 was taxed at 6.25% and income above $60,000 was taxed at 6.45%. Those with higher incomes had a much larger portion of their income taxed at nearly double the rate of those earning less $30,000; the higher percentage reduction in their tax liability is merely a byproduct of Kansas’ graduated tax rates.
KCEG makes several other claims about “education cuts” that they attribute to tax cuts. Two of the claims cite a survey they conducted of Kansas school districts, but Ms. McKay refuses to disclose the survey instrument, the number of districts that participated in the survey and any of the supporting data. One image in their presentation says “nearly 50% of districts have seen average class size grow” and another says schools “gained more than 19,000 students but have 665 fewer teachers.”
As shown in Table 3, the facts refute the claim about student increase and teacher decline since the 2013 implementation of tax reform. Comparing the 2012 school year to the 2014 school years, KSDE reports an increase of 5,088 students, an increase of 586 classroom teachers and an additional 112 other teachers (all full time equivalent per KSDE methodology). One would have to go back to 2006 to claim an increase of 19,000 students.

There are many anecdotal reports of class sizes growing but that cannot be attributed to tax reform, as the classroom teacher / student ratio has actually declined since 2012. If class sizes have significantly increased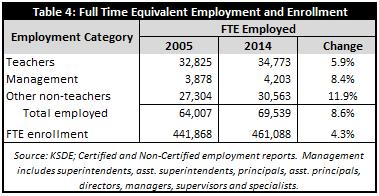 over the last few years it can only be attributed to management decisions at the district level, as there has been very little change in the teacher/pupil ratio. Those same management decisions seem to have prioritized the hiring of management and other non-teaching positions over classroom teachers. Table 4 shows that non-teaching positions grew by 11.5% since 2005, or nearly three times the rate of enrollment. District management jumped 8.4% (on top of a 21% increase between 1993 and 2005).[5] There simply is no data to support KCEG’s claim that tax reform caused class sizes to increase.
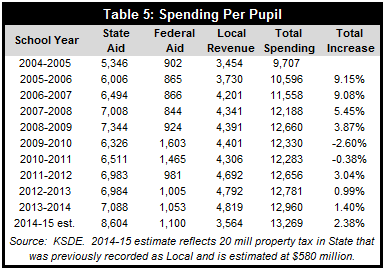
Ms. McKay also falsely represented per-pupil spending as having declined by $1,000 since 2009. As clearly shown in Table 5, the Kansas Department of Education says per-pupil spending will be $609 higher this year and set a third-consecutive record. It should also be noted that districts used $388.6 million in aid to increase carryover cash reserves between 2005 and 2014, or $843 per-pupil based on 2014 enrollment. Aid used to increase cash reserves is not included in KSDE reports of district spending.
The Kansas Economic Progress Council is a statewide non-profit organization of businesses, trade organizations, chambers of commerce and other members that generally support higher government spending, The presentation from KEPC executive director Bernie Koch (pronounced “cook”) was generally designed to show that Kansas’ economic growth trails the region, downplay the importance of lower taxes to business and scare attendees with predictions of possible 5% to 6% state budget reductions.
To explain “How is Kansas Doing?” Mr. Koch showed just one slide, comparing Kansas to six regional states on 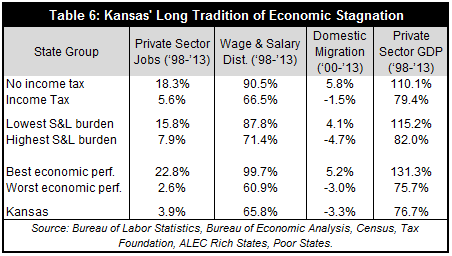 non-farm employment growth over the last twelve months and median household income growth between 2008 and 2013. Non-farm jobs includes government jobs, but that little detail is typically not disclosed by those who use that measure; a one-year comparison also conveniently avoids any perspective. Yes, Kansas is still trailing on a number of economic measurements but that’s not a sign of failure…it’s the reason tax reform was implemented! As shown in Table 6, Kansas was below the performance of its income-taxing peers in every category. States with lower tax burdens have superior economic growth and Kansas often even trails states with high tax burdens. It may seem intuitive to compare a state to its neighbors but those are not the only states with which Kansas competes. It is especially important in today’s global economy that we understand how Kansas competes with all states.
But Kansas is showing progress even on a regional basis. Table 7 lists the states KPEC used in their comparison, but 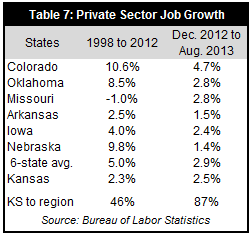 here we compare private sector jobs (the point of tax reform was not to grow government) over two periods – the fourteen years preceding tax reform and the 20 months since. KEPC is correct in saying that Kansas still trails several regional states (although Kansas fares much better when government jobs are excluded) but Kansas is much more competitive – 87% of the other states’ average – than over the fourteen years preceding tax reform, where Kansas was only at 46% of their average. The point here is not that tax reform is ‘working’; it’s far too early to make any declaration regarding the efficacy of tax reform. Rather, it is to demonstrate the importance of trends analysis in honest evaluations of tax reform, which will take many years to be fairly evaluated.
Median household income growth is not a valid measurement because the median can grow or decline simply based on who leaves or enters a state. Consider this simplistic example that demonstrates the math involved. A state has nine households and the household incomes are spread in $10,000 increments from $10,000 to $90,000. Total household income would be $450,000 and median household income would be $50,000. Now let’s assume that the two lowest earners leave the state to seek better opportunities and the incomes of those remaining didn’t change over the year. The state would have seven households remaining with total income of $420,000 (those making $10,000 and $20,000 left) so the median rises to $60,000. It appears that median income jumped but those remaining are no better off. Measurements of total growth rather than median or per capita eliminate such deceptive appearances.
The Bureau of Economic Analysis just released Personal Income total growth results for the second quarter of 2014, listing Kansas as the 14th best in the nation. Here are a few more encouraging signs that show how Kansas is doing (none of which are mentioned by KEPC):
- Kansas beat the national average for real private sector GDP growth in 2013.
- 7th best rate of proprietor income growth in the nation, 1Q 2013 to 1Q 2014.
- #1 in Creighton University’s Mid-America Business Conditions Index, September 2014.
- Private sector job growth in Kansas was only 70% of its income-taxing peers over the last fifteen years but has improved to 87% of the average between December 2012 and August 2014.
Finally, attempting to scare people by saying there could be large spending cuts coming as a result of tax reform is one of the favorite tactics of government and those who profit from government spending – implying that less spending means service reductions. Higher taxes or fewer services is a false choice. The KPI budget plan shows that the state budget can be balanced over the next five years without any service reductions or tax increases. The plan includes new spending on education and Medicaid, and total spending would continue to set records.
All this is possible by making better use of existing resources – providing the same or better quality service at a better price. Citizens do not have to make a false choice; they can have low taxes and good quality service. But there will be fewer spoils to divide among those who profit from government…and that is what is really driving the opposition to tax reform.
[1] Kansas Center for Economic Growth, “Who Pays” page 2, http://realprosperityks.com/kac/wp-content/uploads/2013/12/KS-Center-for-Economic-Growth-Local-Impacts-Report.pdf
[2] Kansas Association of Counties Research Report, May 2013, Figure 6. http://www.kansascounties.org/DocumentCenter/View/1206
[3] Ibid, page 3.
[4] Email from ITEP’s Meg Wiehe dated October 14, 2014
[5] “2014 Public Education Fact Book”, Kansas Policy Institute with data sourced to KSDE. See Table 18. The definition of classroom teachers comes from KSDE; Kansas Policy Institute decided which positions to include under management.


