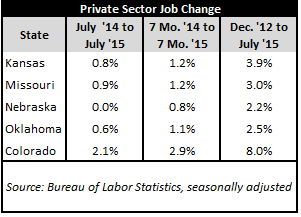
Bureau of Labor Statistics releases for July show Kansas achieving seasonally-adjusted private-sector job growth that is tied for second place among its regional peers. As the table below shows, Kansas posted 1.2% growth when comparing the first seven months of 2015 with those same seven months in 2014. This tied Missouri (also 1.2%) bested Oklahoma and Nebraska (1.1% and 0.8% respectively) while trailing only Colorado (2.9%).

A longer-term look back at the period from December 2012—when Kansas implemented tax reform— to July 2015 shows that Kansas’ 3.9% growth over the period was a lone second best in the region behind only Colorado (8.0%).
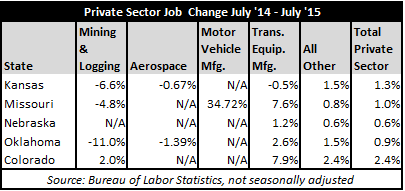
A deeper but shorter-term look at private-sector job growth in the region from July 2014 to July 2015 continues the illustration highlighted in our last two jobs updates. Namely, industry-specific job growth fluctuations and/or revisions in the raw, preliminary numbers reported can color a state’s job growth picture inordinately positively or negatively over a given time period. The table below examines private-sector job growth in four industries across the region to make this point. Consider—for example—the aerospace manufacturing industry. Within the region, it is only large enough in Kansas and Oklahoma to be tracked and reported. Next, consider the motor vehicle manufacturing industry, which is only large enough to register on reports for Missouri. Finally, the mining and logging industry—which includes oil and gas extraction—is large enough to be reported for Kansas and all of its regional peers. Yet, developments within this industry are driven by largely global forces outside of the control of any of the five regional states presented. In short, the industries shown are large ones, subject to developments that occur outside of and apart from individual states, their economies, and policy environments. However, spikes and declines within these industries can lead to quick, surface-level assumptions about the overall health of state economies without examining moving parts and pieces at play in some states but not in others or even at play in all states but on a global scale.

Removing just the four industries included in the table and examining the totality of job growth in “all other industries” that comprise the private sector paints a far different job growth picture—especially for Oklahoma, with 0.9% total private sector growth compared to 1.5% for “all other industries!” What’s more, the “all other industries” segment accounts for more than 93% of each state’s total private sector, meaning that the four categories removed account for less than 7% of the each state’s total private sector. How’s that for disproportionate influence? Check back for next month’s update.


