To the surprise of many legislative observers, a brand new school finance system was proposed last week in House Appropriations with an effective date of July 1, 2017. The unique approach set forth in HB 2741 includes a new method of equalizing capital outlay aid and eliminates the need for Local Option Budget equalization by providing all funding needed to meet the adequacy test through the state budget.
The new system retains some elements from the old system but it is largely a new approach that seems reasonably calculated to give school districts the funding needed to meet expected outcomes while requiring more efficient use of taxpayers’ money, which is the Supreme Court’s constitutional test on adequacy. It is not the Court’s role to determine the actual amount of funding, but as they specified in Gannon, to determine whether the funding provided is “…reasonably calculated to have all Kansas public education students meet or exceed the standards set out in Rose and presently codified in K.S.A. 2013 Supp. 72-1127.” The test is whether funding is reasonably calculated (how the Legislature arrived at the decision) rather than whether they selected a particular level of funding.
The plan is also much easier to understand than the old byzantine formula and should dramatically streamline the budgeting process as well as providing a great deal more predictability to local school boards.
Taxpayers should appreciate the first-ever efficiency requirements built in to the plan; our recent statewide market search study found that 88 percent of Kansans believe local school boards should make efficient use of taxpayer money and 73 percent believe there should be some efficiency requirements included in a school funding formula. But there will also likely be considerable pushback on this plan since it’s not the ‘blank check’ that some would like to see provided.
For the record, school funding set another new record last year at $13,124 per pupil and was 45 percent higher than inflation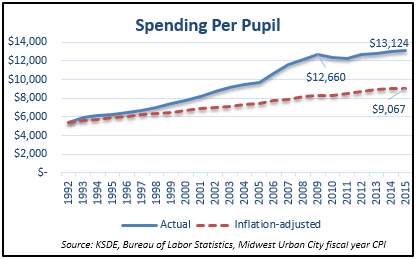 -adjusted funding of $9,067. KPERS only accounted for a small portion of the increase, as non-KPERS funding was 40 percent above the inflation-adjusted level.
There are many changes to examine in the 95-page bill but in the interest of a quick turnaround, this review is focused on the major components and does not attempt to touch on every single change.
Funding Scorecard
The new system provides per-pupil funding based on actual amounts spent by districts in the 2015 school year (adjusted in later years for inflation) which provides a good baseline comparison with actual 2015 spending. Spreadsheets provided to legislators and others this morning by Senator Steve Abrams (chair of Senate Education) tabulate various funding sources and efficiency measures for comparison to each district’s actual 2015 spending; temporary ‘hold harmless’ funding is then provided to districts whose funding would have been less than actual 2015 spending adjusted for efficiency measures.
Funding would have totaled $6.007 billion in 2015, or $93 million more than actual spending 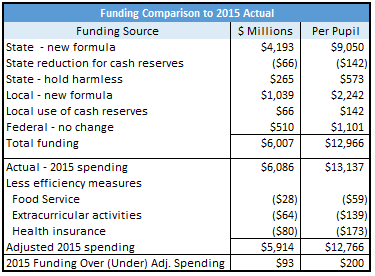
would have been with the efficiency measures built in to the new system. Implementing those efficiency measures is relatively simple: (1) districts simply need to choose to not lose money on food service by reducing costs or raising lunch prices, (2) purchase lower cost health insurance and (3) either increase extracurricular revenue, reduce costs or use new authority to levy 2 mills of property tax for the extracurricular savings.
There are also carryover cash savings would last for three years, during which time districts must collectively find just 1.1 percent of operating cost savings thereafter to make up the difference. Funding would have been slightly below adjusted spending without the hold harmless payments, but districts will have three years to find an additional 4.5 percent in operating efficiencies before the hold harmless payments end.
But the money spent on hold harmless payments won’t necessarily go away. The bill also makes provision for Success Grants to go to schools hitting certain academic outcome growth targets. The success grants appear to go to all districts and distributed on the relative success of each district to all the others. There’s nothing wrong with rewarding true success but giving money to every district regardless of its outcomes lacks the incentive needed to close achievement gaps and raise all performance. Alternatively, perhaps the plan could only reward success in individual buildings beyond a certain minimum and give all or most of the reward as bonuses directly to building employees.
After implementing the efficiency measures in the bill, 118 of the state’s 286 districts would have received a net funding increase in 2015. Generally speaking, those that would have received less were spending significantly more than similar sized districts but not getting better results.
The new system also proposes to provide all funding deemed to meet the Legislature’s adequacy 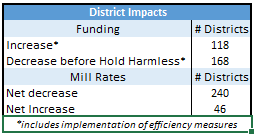 requirements through the state budget rather than a combination of state and local funding. The state’s mandatory 20 mills of property tax would be increased to 35 mills and Local Option Budget mill rates and other small operating mill rates are eliminated, which results in a net mill rate reduction for the residents of 240 school districts totaling $113 million. If every district implements the optional 2 mills for extracurricular activities, residents of 201 districts would still see a net property tax reduction totaling $49 million.
Basic Premises
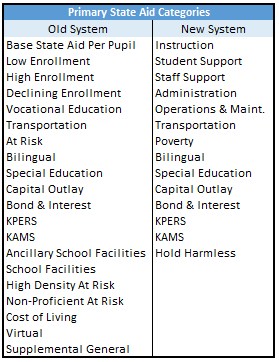
Instead of a long list of enrollment ‘weightings’ to account for differences in enrollment size and multiple types of instruction which were used to increase a single per-pupil amount ($3,852 for Base State Aid in the old system), the new system funds Enrollment Aid for five cost centers – Instruction, Student Support, Staff Support, Administration and Operations/Maintenance – at per-pupil levels that vary with district enrollment. This approach is much easier to understand and greatly streamlines the budgeting process for school districts.
The smallest districts (enrollment less than 400 full time equivalent students) would receive $8,490 per pupil, reflecting the higher cost of operating smaller districts. The adjacent table 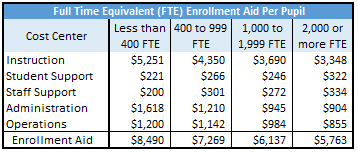 shows how Enrollment Aid declines as the size of districts increase, with districts of 2,000 or more students funded at $5,763 per pupil.
Enrollment aid is calculated as the average amount spent in each cost center in districts where at least 70% of not-low-income students were performing at grade-level on the 2015 state assessment test. (The Operations component of Enrollment aid is the exception and is based on median spending.) The Enrollment Aid amounts were based on spending from the following funds: General, Supplemental General, Adult Education, Adult Supplemental Education, Virtual, Driver Training, Extraordinary School, Professional Development, Parents as Teachers, Summer School, Vocational, Special Liability, Retirement, Contingency, Textbook and Tuition Reimbursement. Spending from other funds (At Risk, Special Education, etc.) were excluded from the calculation because separate funding would be provided for each.
In effect, the methodology is an honest version of what Augenblick & Myers was supposed to do in their 2001 cost study – find the spending level of districts that, at the time, were considered academically successful by KSDE standards. Had they followed their own methodology and done so instead of ignoring efficiency to produce artificially inflated numbers, funding recommendations would have been lower and lawsuits may have been avoided.
Additional state funding is provided for:
- Transportation – using the same methodology as the old system but correcting a math error that caused funding to be $15 million higher than intended.
- Poverty – $3,099 per-pupil for the estimated number of students living at or below the Federal Poverty Level as determined by the U.S. Census. This is a higher amount per-pupil but total funding is slightly less because Census data reflects fewer students need to be funded. This funding was previously called ‘At Risk’ and was largely based on the number of students that school districts were able to sign up for Free or Reduced Lunch.
- Bilingual – for English Language Learners, calculated similarly as before.
- KPERS – calculated the same as before.
- Special Education – calculated the same as before.
- Capital Outlay – equalized with new methodology.
- Bond & Interest – no change in equalization funding for bonds already issued but new bond proposals are subject to approval by a new review committee; eligible projects are funded with a new equalization method.
- Hold Harmless – temporary ‘hold harmless’ funding is provided to districts whose state funding plus efficiency measures is less than the prior year spending.
Enrollment under the old system was simply the full time equivalent count as of September 20 each year, which required districts to set their budget before knowing how many students would be enrolled. The new system uses average enrollment from September 20 and March 20, with adjustments that appear to minimize the funding impact of enrollment declines.
The Local Option Budget as it functions today (part of adequate funding) goes away but the new system allows districts to levy a local property tax for ‘extra’ operating spending, with ‘extra’ meaning above and beyond the amount deemed to be adequate and therefore not subject to equalization funding by state taxpayers. That ‘extra’ funding would have to be used for purposes identified by each district and approved by voters.
Districts continue to be able to levy a local property tax for capital outlay and bond issues approved by voters and may also continue to generate income from fees, gifts and interest income.
Efficiency Measures
The new system distributes ‘hold harmless’ aid on the expectation that districts enact the three efficiency measures outlined earlier and take use of excess carryover cash into account. There is no requirement for districts to implement the efficiency measures, but they would have to find other ways to reduce costs should they choose not to take these actions:
Food Service – districts collectively spent $28 million more on food service in 2015 than was generated by meal fees. The goal is to break even by increasing meal prices, reducing costs (as recommended in numerous Legislative Post Audit reports) or some combination thereof.
Extracurricular activities – districts do not track extracurricular activity spending but information provided to the interim 2015 Special Committee on K-12 Student Success by KSDE allows it to be reasonably estimated that $105 million was spent across all districts in 2015. Activity fees totaled $33 million, leaving a $72 million shortfall. The goal is to reduce the ‘loss’ by increasing fees, reducing costs ($46 million was spent on coaching salaries alone), charging up to 2 mills of property tax for additional income or some combination thereof. FYI, 2 mills of property tax would generate $64 million and is the amount assumed to be saved for purposes of distributing ‘hold harmless’ aid.
Health insurance – implement a variation of the Alvarez & Marsal state efficiency recommendation.
Carryover cash – implement the Alvarez & Marsal state efficiency recommendation, by proportionally reducing state aid to districts with excess carryover cash. Each district with more than the recommended 15% carryover ratio (operating cash as a percent of operating expense) would have its state aid reduced by the difference spread over three years (A&M recommended four years).
District Spreadsheets
The first spreadsheet compares each district’s actual 2015 spending with funding that would have been provided had the new system been in place that year. The second spreadsheet shows the districts in which residents would receive a net property tax reduction.
The new proposal also includes Educational Savings Accounts or ESAs, which would allow parents to decide where to spend educational dollars in their child’s best interests. A separate article on the ESA proposal will be published soon.


