The Kansas Association of School Boards produced a report recently which some are saying proves that spending more money leads to better outcomes, but even KASB says that is a misinterpretation. I asked Mark Tallman of KASB if that was the case and he replied, “I specially [sic] said to the group of legislators we invited to lunch that we do NOT claim this report “proves” spending “causes” outcomes changes.”
Mr. Tallman went on to explain that “…the data indicates that higher spending over time is more often than not a “predictor” of higher NAEP scores, and usually has a positive correlation with higher results. We do not say that correlation proves causation.”
Our review of the data says otherwise, as does that of many other respected school funding experts including Dr. Eric Hanushek of the Hoover Institution at Stanford University, who says, “…the outcomes observed over the past half century – no matter how massaged – do not suggest that just throwing money at schools is likely to be a policy that solves the significant U.S. schooling problems seen in the levels and distribution of outcomes. We really cannot get around the necessity of focusing on how money is spent on schools.”
Bi-variate analysis
The KASB report takes only two variables into account – spending and achievement. It’s called a bivariate analysis (two variables), which doesn’t allow for meaningful conclusions. Dr. Benjamin Scafidi, Director of the Education Economics Center at Kennesaw State University, says, “…they do not control for the many other factors that impact student achievement. Social scientists do not put much stock into bivariate relationships like the KASB [example] below.” Dr. Scafidi’s remarks were directed at the 2013 KASB report that also only looked at changes in spending and achievement.
One such factor ignored by KASB is the impact of Common Core. When Kansas’ NAEP scores dipped in 2013, the Kansas Department of Education told legislators that they couldn’t identify a particular reason but did note that the transition from previous teaching methods to Common Core may have been a factor. They again honed in on the transition to Common Core to explain the 2015 NAEP decline to legislators this month. KSDE did not blame funding in 2013 or 2015.
Data refutes notion that spending predicts outcomes
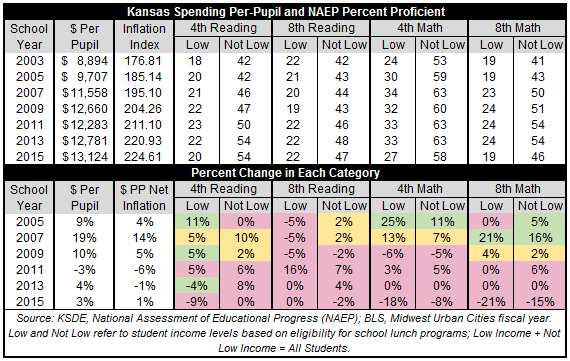
This table lists 8 bi-annual changes in proficiency measurements for each of the last 6 NAEP reports, for a total of 48 total changes; proficiency levels for Low Income students and those who are Not Low Income are shown for two subjects (Reading and Math) for two grade levels (4th and 8th Grades). In the majority of comparative instances, changes in inflation-adjusted (real) spending did not correspond to changes in proficiency levels. That is,
- In 31 of the 48 comparative instances, real spending increased while proficiency levels declined or failed to increase, or real spending declined while proficiency levels increased or failed to decline (RED).
- In 9 of the 48 comparative instances, the increase in proficiency levels was less than the increase in real spending (YELLOW).
- In 8 of the 48 comparative instances, the increase in proficiency levels was greater than or equal to the increase in real spending (GREEN)
We performed the same analysis on changes in the national averages, although spending is only available through 2013, so there are only 40 comparative instances. Once again, spending is not a predictor of outcome changes; indeed, in 20 of those 40 instances, real spending increased while proficiency levels declined or failed to increase, or real spending declined while proficiency levels increased or failed to decline (RED). Most notably, real spending declined in 2011 and 2013, but proficiency levels increased in all 8 measurements both years!
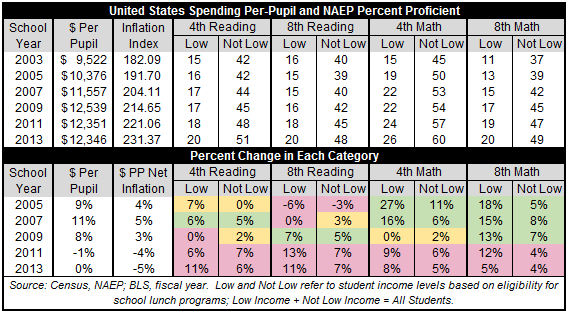
Our analysis is very straightforward; the changes in spending and every measurement of proficiency are examined separately. KASB based their findings on 8-year averages rather than individual years, which masks fluctuations by allowing gains to offset losses; the results are further skewed depending upon the starting point and length of the average. KASB also combines proficiency levels for 4th Grade Reading and Math as well as 8th grade Reading and Math by averaging those four disparate percentages into a single number, which again hides information. That methodology could present the appearance of improvement (especially by careful selection of the 8-year starting point) even though one or more grade levels and/or subjects could be in decline (which indeed happened). Such manipulation may allow KASB to justify more spending but it disregards the importance of understanding the true causes of student achievement.
It should be noted our explanation of their methodology is based on our reading of their report; KASB has not responded to requests for their underlying calculations.
KASB also claims that “higher spending states are more likely to have higher results” but once again, the data is contradictory. If spending more money was a “predictor” of higher outcomes, the points on these scatter plots of spending and proficiency levels would be grouped along a line of increasing slope but they are ‘all over the map’.
New York schools spent the most at $22,902 per-pupil and had 4th Grade Reading proficiency levels of 21% and 53%, respectively, for Low Income and Not Low Income students. North Carolina schools however, spent just $8,879 per-pupil yet had proficiency levels of 25% and 59%, respectively. There are many other examples all across the proficiency ranges of grade levels, subject and student income groups where states achieved the same or relatively the same outcomes while spending significantly disparate amounts.


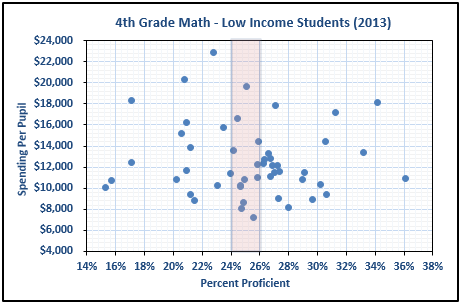
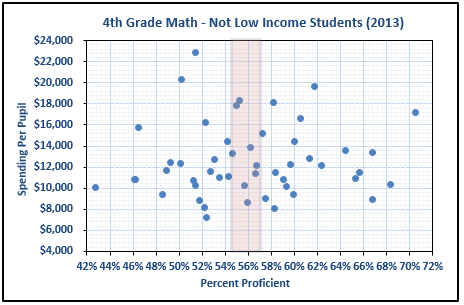
Higher spending would absolutely be a predictor of higher tax bills for citizens but there is no correlation between spending and achievement in the data.
Spending more money may create more opportunity to improve outcomes but only if the extra money is well-spent. As Dr. Hanushek notes, “It’s absolutely true that if you spend money well, it has an effect,” he said. “But just putting money into schools and assuming it will be spent well isn’t necessarily correct and there is substantial evidence that it will not happen.” And as has been documented time and time again over the years, there is certainly is evidence of money not being well spent in Kansas.
Achievement matters, not national rankings
KASB makes much of the fact that national rankings on NAEP declined (“Kansas has fallen from a national leader to merely an above average performer”) and they use that emotional appeal to push for more money. But actual achievement should be the focus instead of national rankings, especially in a nation that doesn’t perform very well. For example, Indiana is ranked #1 for 4th Grade Low Income students in Reading – at just 36% Proficient!
Kansas may have had higher national rankings in the past but look at these proficiency levels and decide for yourself: was achievement in any grade or subject ever at acceptable levels?
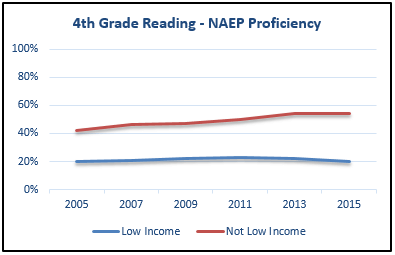
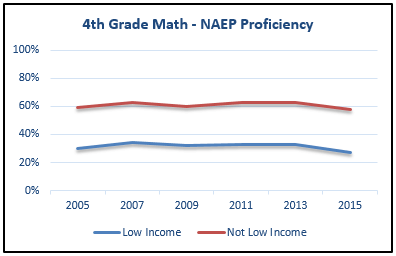
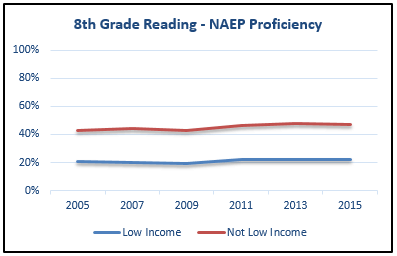
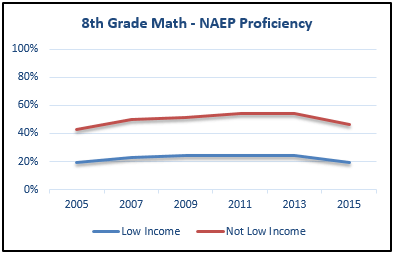
After nearly a $2 billion funding increase over the last ten years, only a quarter or less of low income students and only about half of the rest are Proficient on NAEP Reading and Math exams. A “C” or a “D” may be one of the highest grades in the class but not scoring as badly as one’s classmates is no indication of acceptable outcomes. Attempting to justify pouring more money into the same system that produced these outcomes is simply about getting more money for the system; it most certainly is not student-focused.
The definition of insanity is doing the same thing over and over and expecting different results. We have tried dramatically higher real (inflation-adjusted) spending in Kansas public schools (43.5% per-pupil over the last 25 years) and in public schools around the nation. For Kansas, those increases in spending into the current education system have yielded the results just above. It is time for Kansas policymakers to call a new play. Our students deserve no less.
Post Script: We thank education economists Dr. Erick Hanushek and Dr. Benjamin Scafidi for their review and input on this analysis. For a teacher’s perspective on this subject, see David Dorsey’s thoughts on the Topeka Capital-Journal Blog.


