Last week we explained why we believe education budgets shouldn’t be exempt from COVID budget cuts. In short, there can be no ‘sacred cows’ when the state is facing upwards of a $1 billion budget deficit next year and K-12 consumes about half of General Fund spending.
Today we’ll explore some of the many school budget savings opportunities for state and local officials to consider. Only the geekiest (like me) may stay awake reading through a list of all the budget savings opportunities, so this column will look just at a few with savings in the 8-figure and 9-figure range.
Set operating cash reserves at 2005-06 levels
In addition to spending more than necessary, school districts haven’t spent all the state and local tax dollars they receive. District operating cash reserves, shown in green on the chart below, increased from $468 million in 2005 to $942 million last year. Most of the $474 million increase in those reserves represents state and local tax dollars that weren’t spent. (Government funds operate just like your checkbook; the balance increases when deposits – tax dollars – exceed spending.)
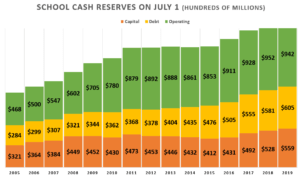
Recommendation – determine the amount that each district would have in reserve if it had the same carryover ratio as the 2006 school year; deduct the excess from next year’s state funding. Based on last year’s cash and spending levels, this would generate one-time savings of $329 million in the state budget.
The carryover ratio is the operating cash on hand at the beginning of the year as a percentage of that year’s operating expense. Costs associated with KPERS and federal spending would be excluded as those amounts are not included in the operating cash reserve totals. The carryover ratio for the base year would be operating reserves on July 1, 2005, divided by actual operating expense for the 2006 school year.
The average ratio then was 12.3% but it varied greatly, going from a low of 0.5% to as much as 38.3%. A plurality of 118 districts had carryover ratios between 5% and 10%, and another 32 districts had ratios below 5%. This is important because it demonstrates that districts can function with carryover ratios below 10% if they have good cash management practices.
There is no record of districts saying they didn’t have sufficient operating cash reserves in 2005 and they aren’t bashful about saying they don’t have enough money, so there is merit for this baseline. There are 239 districts with higher carryover ratios today, not counting the districts that didn’t exist in 2006.
Stop losing money on foodservice
Last year, 252 districts collectively lost $17.4 million on their foodservice operations. But 34 districts spent less than they collected from student and adult meals, so it’s clear that losses can be avoided.
Recommendation – local school boards should make reduce costs and/or increase meal prices a few cents to break even. Districts that provide discounted meals to adults should consider charging full price.
There are multiple options to reduce costs without sacrificing food quality. A few years ago, a Derby school board member asked why they were spending over $25,000 per month at the local Walmart; he was told the cafeteria often ran short on ingredients and paid full retail at Walmart instead of buying from their bulk vendor at lower costs. (The district also spent money there on school supplies rather than using their Office Max discount prices.)
Outsourcing meal preparations and service is another option, which has the added advantage of reducing high pension costs for school employees.
Right-size staffing levels
Disparate per-student staffing levels among districts with similar enrollment indicate some of them could save considerable money. That’s not to say that a simple metric can determine the proper number of employees per district, but there’s empirical evidence that some districts could operate with less staff.
Recommendation – local school boards should compare staffing levels to districts with similar enrollment to reduce staff wherever possible.
The table below shows the number of managers employed in 2019 by districts with more than 5,000 students. Managers include superintendents, assistant superintendents, principals, assistant principals, directors, instruction coordinators, and curriculum specialists.
USD 385 Andover has the best ratio, at 242 students per manager, while USD 501 Topeka has the worst ratio at just 86 students per manager. USD 512 Shawnee Mission had more than 200 students per manager until 2017, so we know it’s possible for larger and smaller districts in this cohort to achieve that level.
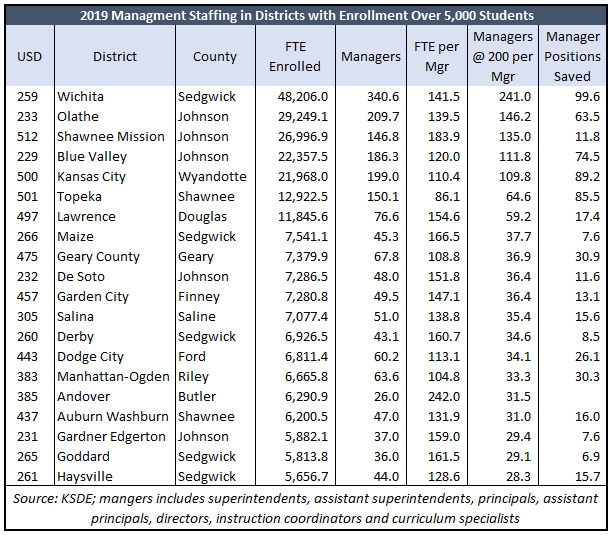
To demonstrate the potential savings, there would be 631 fewer management positions in just these large districts if each employed one manager for every 200 students. That’s a savings of $631 million if the average savings of pay and benefits is $100,000.
Provide non-instructional services through regional service centers
The fact that there are 286 school districts with an average enrollment of just 1,666 accounts for part of the unnecessary spending. Last year, there were seven districts with fewer than 100 students. Some states have just one district per county and Hawaii has only one district for the entire state. Low enrollment per district prompts a lot of controversial discussion over consolidating the number of districts, but a different type of re-organization has broad appeal. (Fun fact: Kansas once had more than 9,000 school districts.)
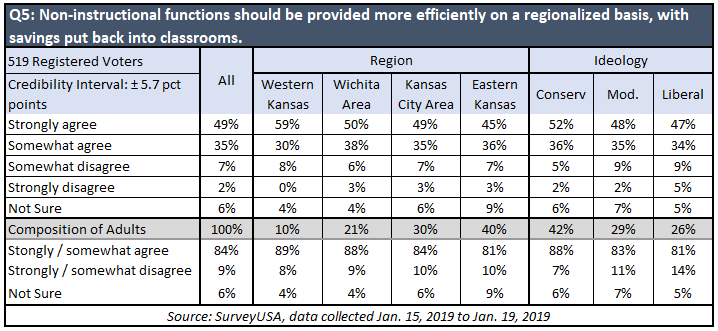
A January 2019 survey conducted on our behalf 84% of registered voters support the concept and only 9% are opposed. Results are very consistent across all geographical and ideological lines. The results may certainly vary if the question didn’t include the proviso of putting savings into classrooms, but then again, perhaps not by much since the alternative now is higher taxes or severe budget cuts to other services.
 The education lobby – local school boards, unions, and other education employee associations – are strongly opposed. But that shouldn’t stop legislators from building a different education service delivery system.
Recommendation – convene a task force consisting of educators and private sector experts in procurement, logistics, information technology, supply chain management, accounting, payroll, and other areas to develop a regionalized delivery system for non-instructional services. The system should include the use of private sector outsourcing as well as the existing school district regional service centers.
The savings potential would depend upon the final system design, but it could easily be in the 9-figure range.
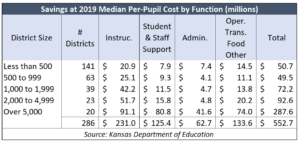 The adjacent table shows that just getting districts with similar enrollment to the median per-pupil spending level within their enrollment classification would have saved $553 million last year. Instruction accounted for $231 million, but that still leaves $322 million for the non-instructional functions. There would also be some capital outlay savings in a regionalized concept.
Conclusion
There’s no question that Kansas school districts can save a great deal of money without compromising achievement. Adjusted for cost of living differences, Kansas had the 17th highest spending per pupil in 2017, at $14,911, but was ranked #27 on the National Assessment of Educational Performance. Seventeen states spent less per pupil than Kansas but had higher NAEP scores.
And as we’ve reported many times before, achievement in Kansas is flat to down over time while spending has skyrocketed.
Media and education officials will threaten to have legislators tossed out of office for even suggesting that schools should cut waste, but leaders are able to face the music and make the tough but necessary decisions. And Kansas needs leaders now more than ever.